Measured Points
Measured P
Original (27 May '92)
Summer 1 (22 Sep '92)
Original (27 M
Winter ( 2 Jun '93)
Summer 1 (22
Summer 2 (22 Sep '93)
0
1m
Winter ( 2 Jun
Summer 2 (22
Parrachutte
Pa achu e
Pooll
Poo
Slump
Block
Pr
ofi
St
le
ak
es
Pr
of
ile
0
5m
Hub
Hub
b. Sites 35.
a. Site 1.
Summer 1 (22 Se 92)
Winter ( 2 Jun '93)
Summer 2 (22 Sep '93)
Hub
file
Stakes
Pro
Scarp
eg
lw
Tha
lly
Gu
0
10 m
c. Sites 810.
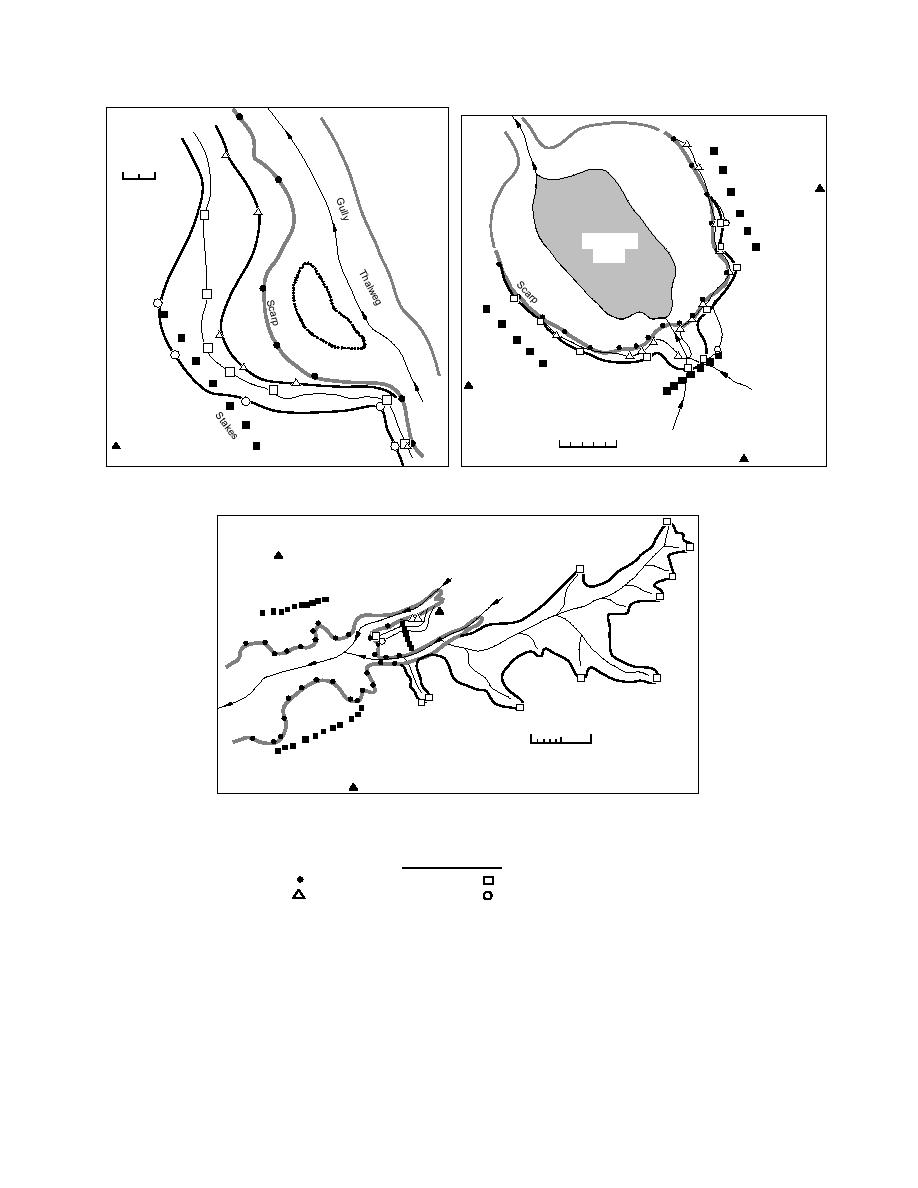
Figure 30. Examples of spatial variation in erosion rates measured at gully headwall sites. Only changes are
shown by symbols.
Measured Points
Winter ( 2 Jun '93)
Original (27 May '92)
Summer 2 (22 Sep '93)
Summer 1 (22 Sep '92)
lower accretion rates than the ponds (Table 7),
while within gullies, rates could far exceed these
SEDIMENTATION RATES
values. Lower sedimentation rates in marshes
may reflect problems in sampling within the
Sedimentation rates vary with morphological
thick sedges, including an unknown amount
unit and, in a general sense, with elevation. The
trapped in the vegetation, rather than the actual
overall trend is an increase eastward from the
rate of accretion.
Eagle River levees, across the mudflats and into
The relationship of rate to elevation is in part
the ponds. Marshes, however, apparently had
a response to the number of times sites are inun
32


 Previous Page
