6
1600
5
1200
Depth to Flooding
800
4
400
3
0
17:00 18:00 19:00 20:00 21:00 22:00 23:00 24:00 01:00 02:00 03:00
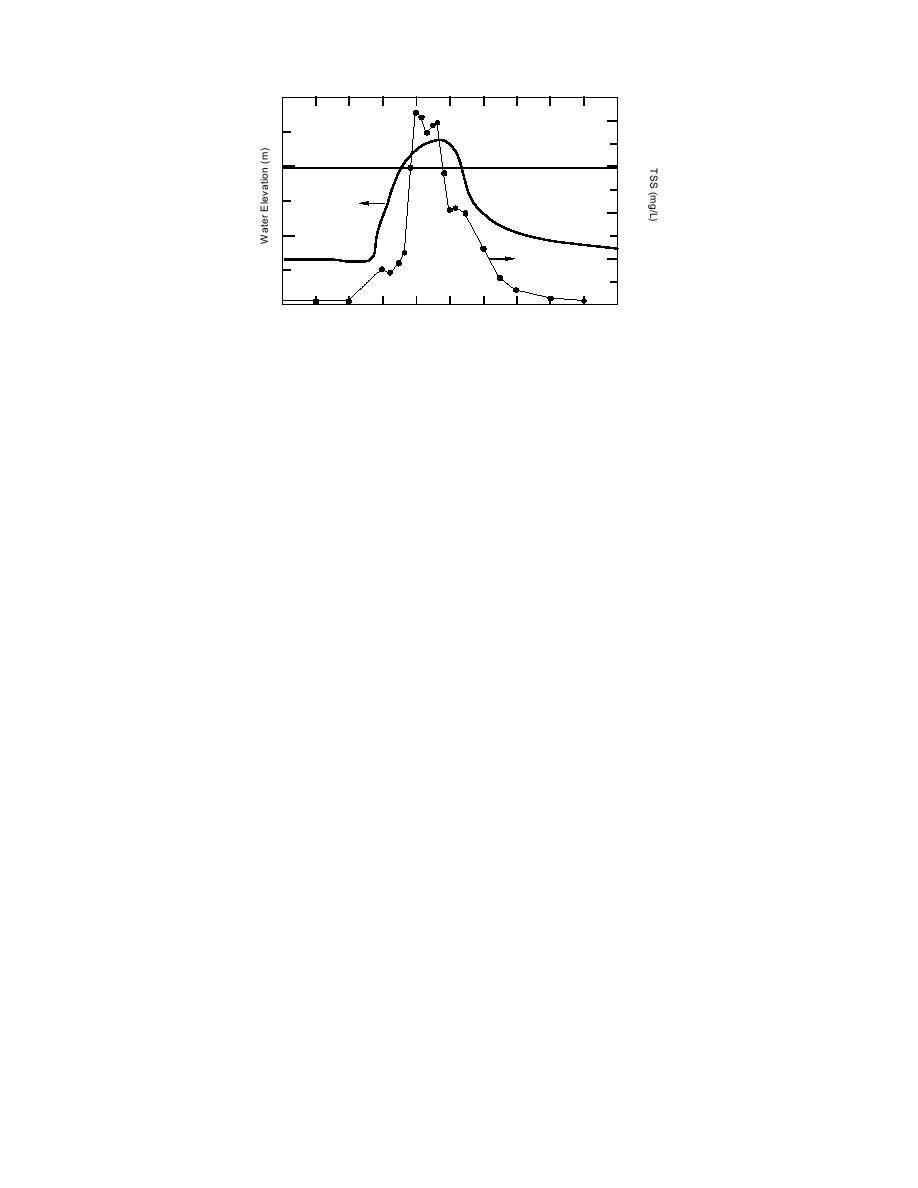
Figure 23. Total suspended sediment concentrations and water
elevations at Parachute drainage, 1718 September.
stages of ebb, as well as for several hours prior
SEDIMENT TRANSPORT
to high tide.
Sediments are deposited within ponds and
In the first sampled event of 15 September,
mudflats mainly through settling-out from
flood levels were barely high enough to spill
waters flooding ERF (Table 3). New materials are
onto the mudflats above the gullies and low TSS
in suspended transport by river and tidal flood
peaks were recorded at both sites (170 mg/L)
waters, while a second source is sediment eroded
(Fig. 22). Subsequently, the morning tide of 16
and remobilized from the pond bottoms and
September flooded most of the Flats up to about
mudflats by wind currents, bottom-feeding wa-
0.2 m depth; both Parachute and Bread Truck
terfowl and other mechanisms. River currents
had similar TSS peaks of approximately 1250
may also erode sediment from riverbanks; gullies
mg/L. Flooding cycles sampled on 17, 18 and 19
likewise can be eroded by flood or ebb currents.
September were characterized by deeper in-
Total Suspended Sediment (TSS) in discrete sam-
undation (about 0.4 m) and higher peak TSS val-
ples and the continuous recording of turbidity by
ues. TSS peak values in the Parachute drainage
an Optical Backscatter Sensor (OBS) provide data
were 1700 and 1900 mg/L, exceeding the Bread
on suspended sediment transport and the rela-
Truck values by 300 mg/L. In general, low sus-
tive importance of sediment sources.
pended sediment concentrations characterized
Samples for TSS analysis were obtained dur-
the rising tide while flood waters moved into
ing the August and September flooding cycles at
each gully. A sharp rise in TSS occurred as the
the Parachute and Bread Truck gully sites (Fig.
rising flood waters from Knik Arm began to
22). During the August cycle, water samples
spill onto the mudflat. Suspended sediment con-
were taken every half hour over 12 hours run-
centrations gradually declined only after ebb be-
ning from low tide to low tide. Relatively low
gan (Fig. 23).
values were recorded at the Bread Truck drain-
OBS turbidity levels peak during flooding of
age in three of four recorded cycles; the fourth
the gully sites in August, generally ranging from
event produced a peak value of 1000 mg/L (Fig.
1300 to 1500 mV (500 to 600 FTU) at Parachute
22b). In one cycle recorded at Parachute drain-
gully and 1200 to 2300 mV (480 to 920 FTU) in
age, the samples captured a peak of 1500 mg/L
the Break Truck gully (Fig. 24a and b). In both
(Fig. 22a).
cases, the OBS values indicate that sediment
This sampling scheme did not sufficiently rep-
concentrations progreasively increase as tidal
resent the variability in suspended sediment con-
waters enter and flood each site, gradually fall-
centration over time and therefore the sampling
ing at a slower rate as ebb takes place and gully
interval was altered in September. Samples were
drainage becomes well established. In Septem-
then acquired every 10 minutes, beginning near
ber both sites had lower ranges in turbidity
the predicted peak high tide at Anchorage and
(about 700 to 1300 mV [280 to 520 FTU] at Bread
continuing through the initial phase of the ebb.
Truck and about 800 mV [320 FTU] at Parachute
The time interval was progressively lengthened
[Fig. 24b, c and d]). The OBS records for a SBE19
to a half hour and then one hour during the latter
CTD temporarily established at the tide gauge
25


 Previous Page
