EM 1110-2-2907
1 October 2003
It is determined by plotting the pixel brightness and calculating its Euclidean distance
(using the Pythagorean theorem) to the unassigned pixel. Pixels are assigned to the
training class for which it has a minimum distance. The user designates a minimum dis-
tance threshold for an acceptable distance; pixels with distance values above the desig-
nated threshold will be classified as unknown.
(b) Parallelepiped. In a parallelepiped computation, unassigned pixels are
grouped into a class when their brightness values fall within a range of the training
mean. An acceptable digital number range is established by setting the maximum and
minimum class range to plus and minus the standard deviation from the training mean.
The pixel brightness value simply needs to fall within the class range, and is not based
on its Euclidean distance. It is possible for a pixel to have a brightness value close to a
class and not fall within its acceptable range. Likewise, a pixel may be far from a class
mean, but fall within the range and therefore be grouped with that class. This type of
classification can create training site overlap, causing some pixels to be misclassified.
(c) Maximum Likelihood. Maximum Likelihood is computationally complex. It
establishes the variance and covariance about the mean of the training classes. This algo-
rithm then statistically calculates the probability of an unassigned pixel belonging to
each class. The pixel is then assigned to the class for which it has the highest probability.
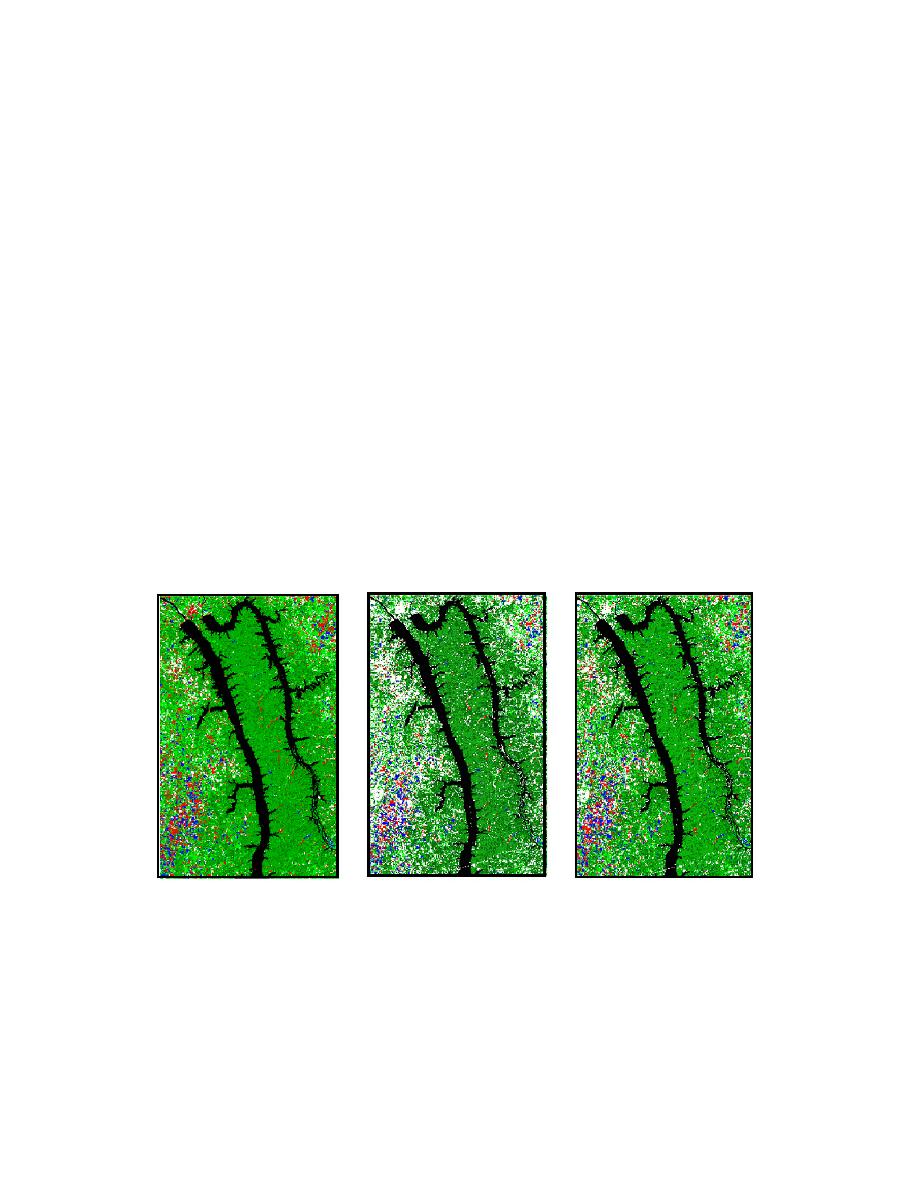
Figure 5-19 visually illustrates the differences between these supervised classification
methods.
Figure 5-19. From left to right, minimum mean distance, parallelepiped, and maximum
likelihood. Courtesy of the Department of Geosciences at Murray State University.
(4) Assessing Error. Accuracy can be qualitatively determined by an error matrix
(Table 5-3). The matrix establishes the level of errors due to omission (exclusion error),
commission (inclusion error), and can tabulate an overall total accuracy. The error ma-
trix lists the number of pixels found within a given class. The rows in Table 5-2 list the
pixels classified by the image software. The columns list the number of pixels in the
reference data (or reported fro m field data). Omission error calculates the probability of
5-33


 Previous Page
