EM 1110-2-2907
1 October 2003
255
PC1
PC2
0
0
255
Band A Brightness Value
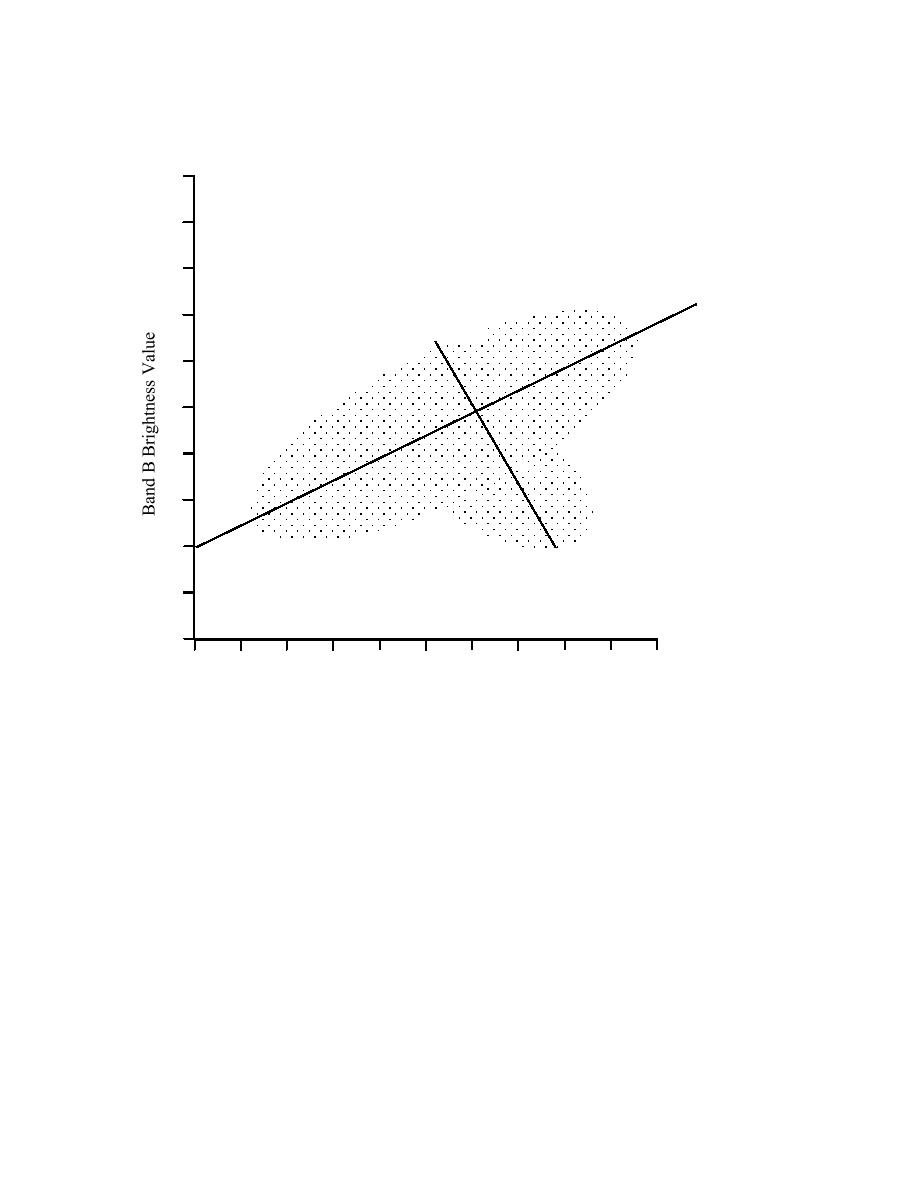
Figure 5-14. Plot illustrates the spectral variance between two bands, A and B. PC1 is the
line that captures the mean of the data set. PC2 is orthogonal to PC1. PC1 and PC2 be-
come the new horizontal and vertical axis; brightness values are redrawn onto the PC1
and PC2 scale.
c. Transformation Series (PC1, PC2, PC3, PC4, PC5, etc.). The process of transform-
ing the axis to fit the maximum variance in the data can be performed in succession on
the same data set. Each successive axis rotation creates a new principal component axis;
a series of transformations can then be saved as individual files. Band correlation is
greatly reduced in the first PC transformation, 90% of the variance between the bands
will be isolated by PC1. Each principle component transformation extracts less and less
variance, PC2, for instance, isolates 5% of the variance, and PC3 will extract 3% of the
variance, and so on (Figure 5-15). Once PC1 and PC2 have been processed, approxi-
mately 95% of the variance within the bands will be extracted. In many cases, it is not
useful to exact the variance beyond the third principle component. Because the principle
component function reduces the size of the original data file, it functions as a pre-proc-
essing tool and better prepares the data for image classification. The de-correlation of
band data in the principle component analysis is mathematically complex. It linearly
5-28


 Previous Page
