EM 1110-2-2907
1 October 2003
d. Image Enhancement #4: Principle Components. The principle component analy-
sis (PCA) is a technique that transforms the pixel brightness values. This transformation
compresses the data by drawing out maximum covariance and removes correlated ele-
ments. The resulting data will contain new, uncorrelated data that can be later used in
classification techniques.
(1) Band Correlation. Spectral bands display a range of correlation from one
band to another. This correlation is easily viewed by bringing up a scatter plot of the
digital data and plotting, for instance, band 1 vs. band 2. Many bands share elements of
information, particularly bands that are spectrally close to one another, such as band 1
and 2. For bands that are highly correlated, it is possible to predict the brightness out-
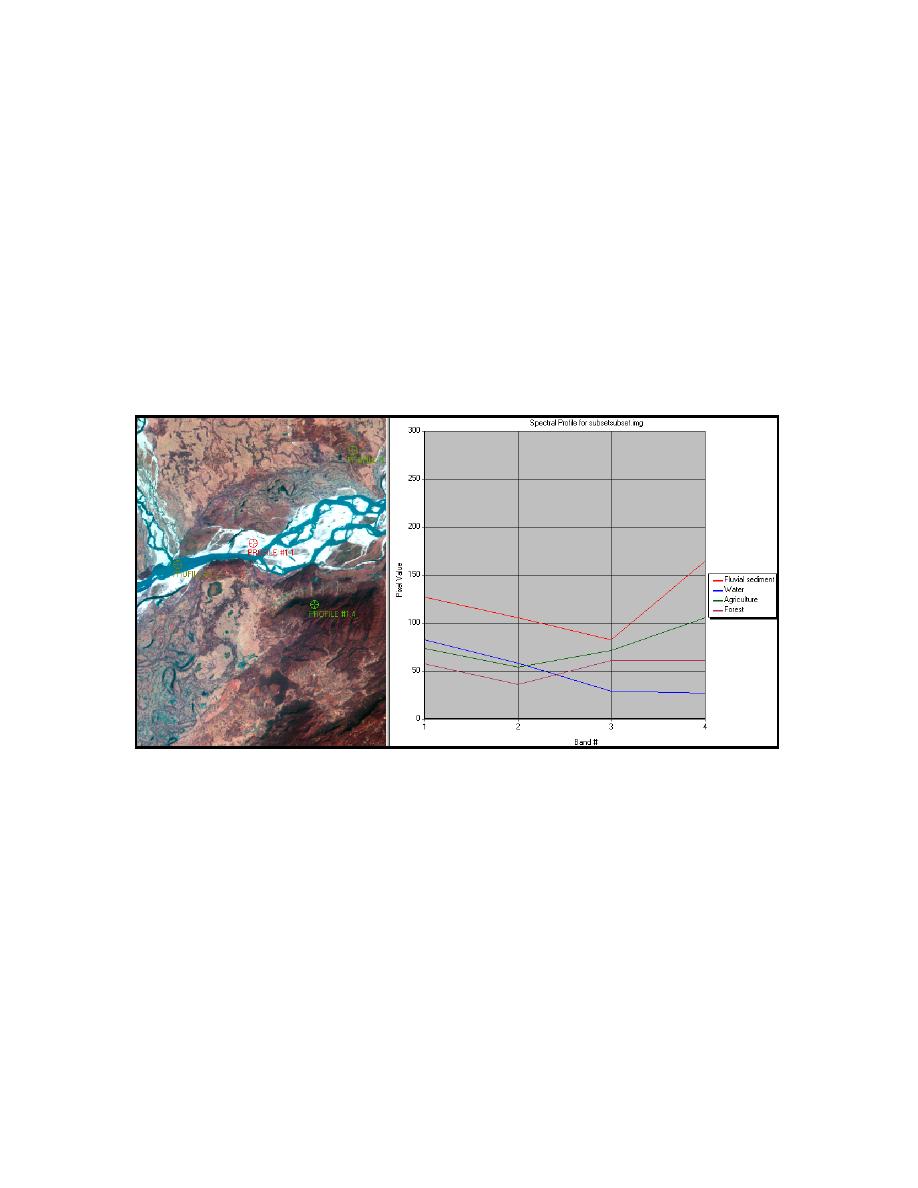
come of one band with the data of the other (Figure 5-13). Therefore, bands that are well
correlated may not be of use when attempting to isolate spectrally similar objects.
Figure 5-13. Indian IRS-1D image and accompanying spectral plot. Representative pixel
points for four image elements (fluvial sediment in a braided channel, water, agriculture,
and forest) are plotted for each band. Plot illustrates the ease by which each element can
be spectrally separarted. For example, water is easily distinguishable from the other
elements in band 2.
(2) Principle Component Transformation. The principle component method ex-
tracts the small amount of variance that may exist between two highly correlated bands
and effectively removes redundancy in the data. This is done by "transforming" the ma-
jor vertical and horizontal axes. The transformation is accomplished by rotating the
horizontal axis so that it is parallel to a least squares regression line that estimates the
data. This transformed axis is known as PC1, or Principle Component 1. A second axis,
PC2, is drawn perpendicular to PC1, and its origin is placed at the center of the PC1 range
(Figure 5-14). The digital number values are then re-plotted on the newly transformed
axes. This transformation will result in data with a broader range of values. The data can
be saved as a separate file and loaded as an image for analysis.
5-27


 Previous Page
