

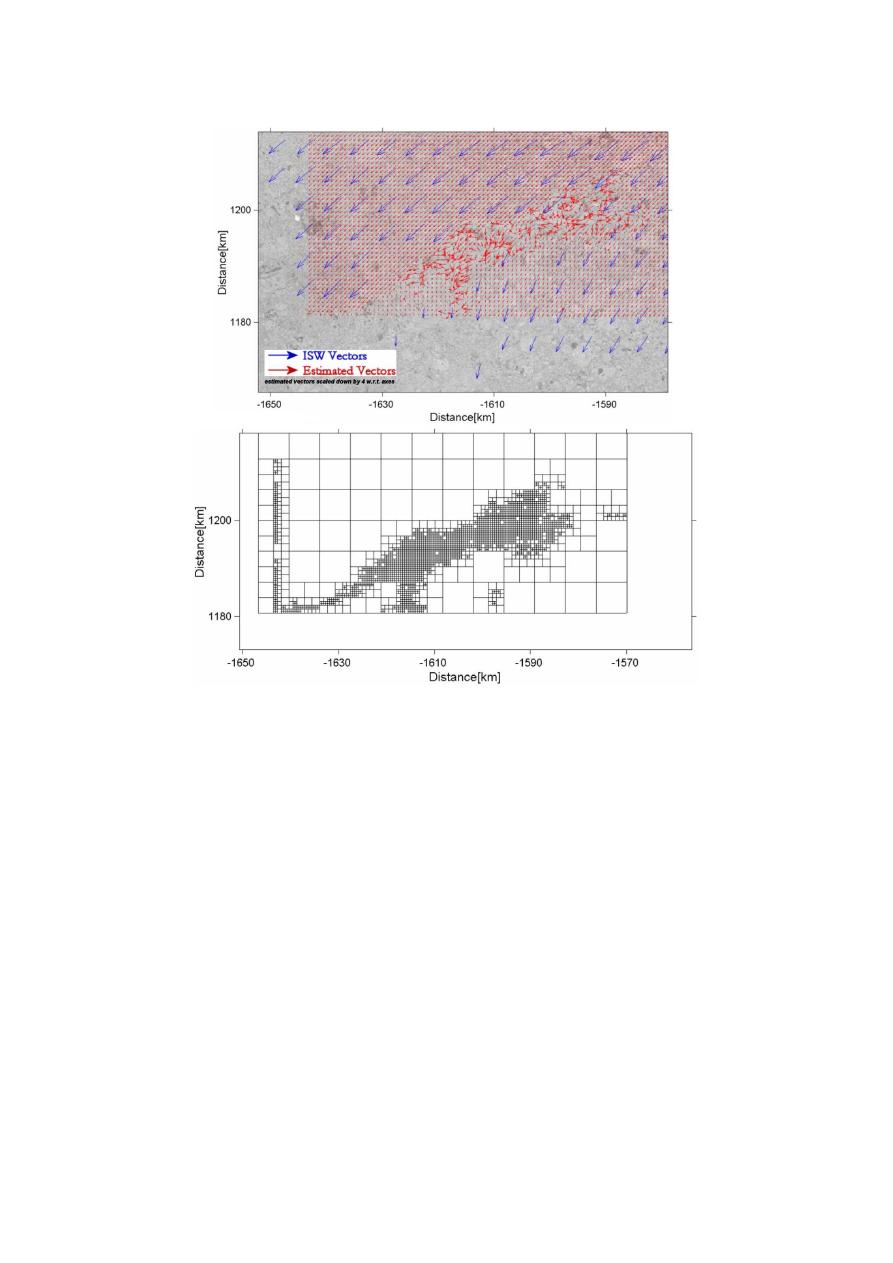
Figure 2. Comparison between the estimated vectors and ISW vectors from the SAR image pair at
orbit 3197 frame 5693 and orbit 3230 frame 5103 at a dynamic zone.
lots of pixels without vector solutions because these pixels
dure reduced the bands of discontinuities within the motion
did not meet our correlation threshold. Such areas require
field and also estimated the motion field at a finer resolu-
a higher order model than our method currently includes.
tion around the peak of the local estimate but at the cost of
We note however, that the local motion is accurate in the
increased computational complexity.
high correlation regions as validated through comparison
Figure 5 is the combined scatter map over all the im-
with the ISW vectors.
age pairs used in this analysis. As can be seen, the ma-
Due to the projection of the non linear components of the
jority of data points (estimated vectors) cluster along the
higher order motion, the local motion so estimated contains
tal number of motion vectors and ngood are the points that
false discontinuities (i.e. false positives). These discontinu-
ities occur due to abrupt changes in the frequency compo-
are within 400 m (4 pixel) of the ISW vectors. This devi-
nents between the two regions under consideration causing
ation is at the threshold of SAR geolocation accuracy [15]
variations in the estimated vector field. To reduce the effect
and therefore a scatter based on instrument accuracy rather
than the technique applied. ndef ormation are all the points
of these false discontinuities, sub-pixel motion interpola-
in the correlation maps having low correlation. Thus 72.8%
tion was carried out using a cubic spline within a window
around the result of the local phase correlation. This proce-
of the estimated motion vectors are accurate with respect

 Previous Page
