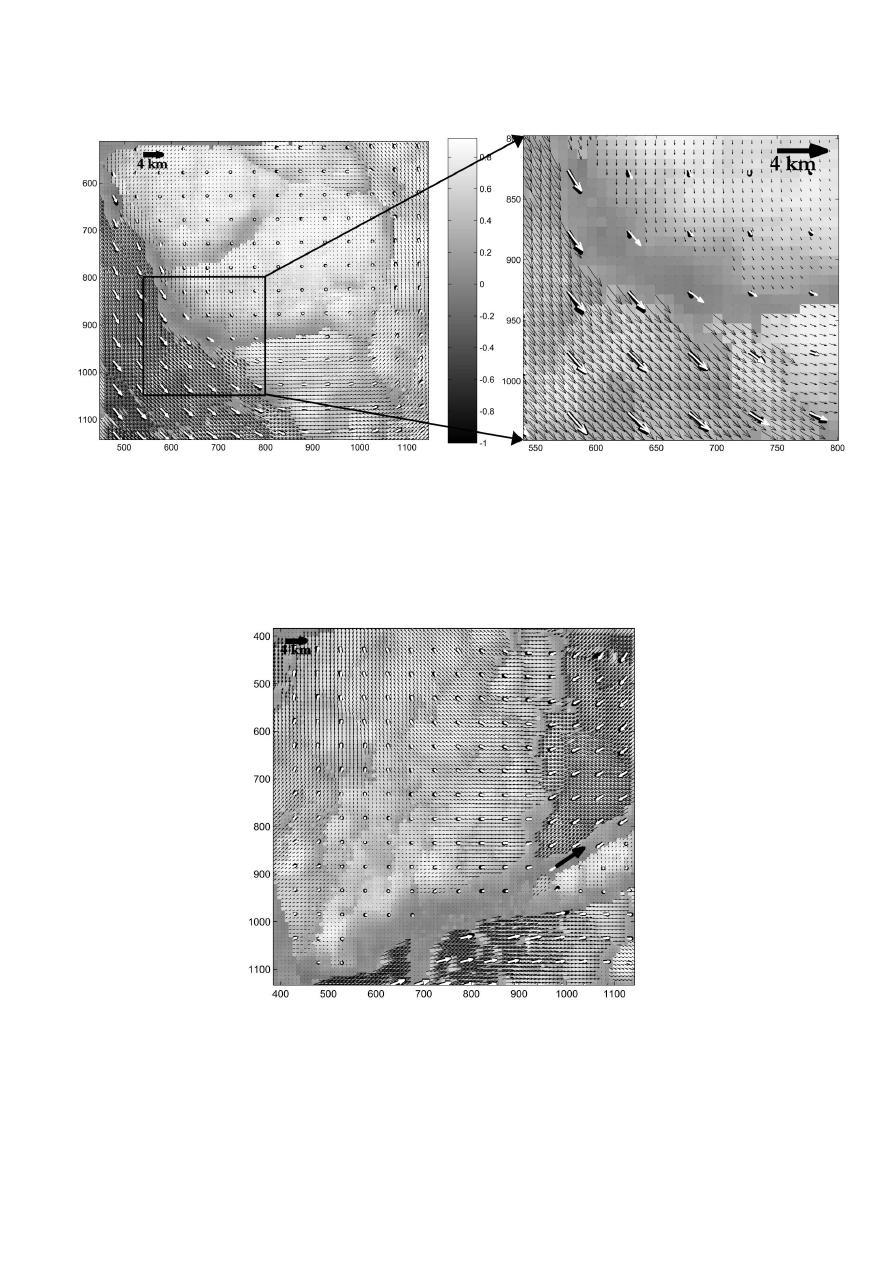
Figure 3. Relative motion field between SAR image pair of orbit 3412 frame 5693 and orbit 3455 frame
5693 is shown. Grey-scale map plotted with lightest to darkest denoting high to low correlation
coefficient with darkest defining discontinuity regions (without motion vectors) in the high resolution
product (0.8 km resolution thin black vectors). Interpolated motion vectors at 5 km resolution (thick
black) further superimposed with coincident ISW vectors (thick white) which hide nearly all of each
thick black vector in validation.
Figure 4. Relative motion for SAR image pair with orbit 3197 frame 5693 and orbit 3230 frame 5103
showing the highly dynamic region presented in Figure 2 earlier.


 Previous Page
