88
ERDC/CRREL TR-02-14
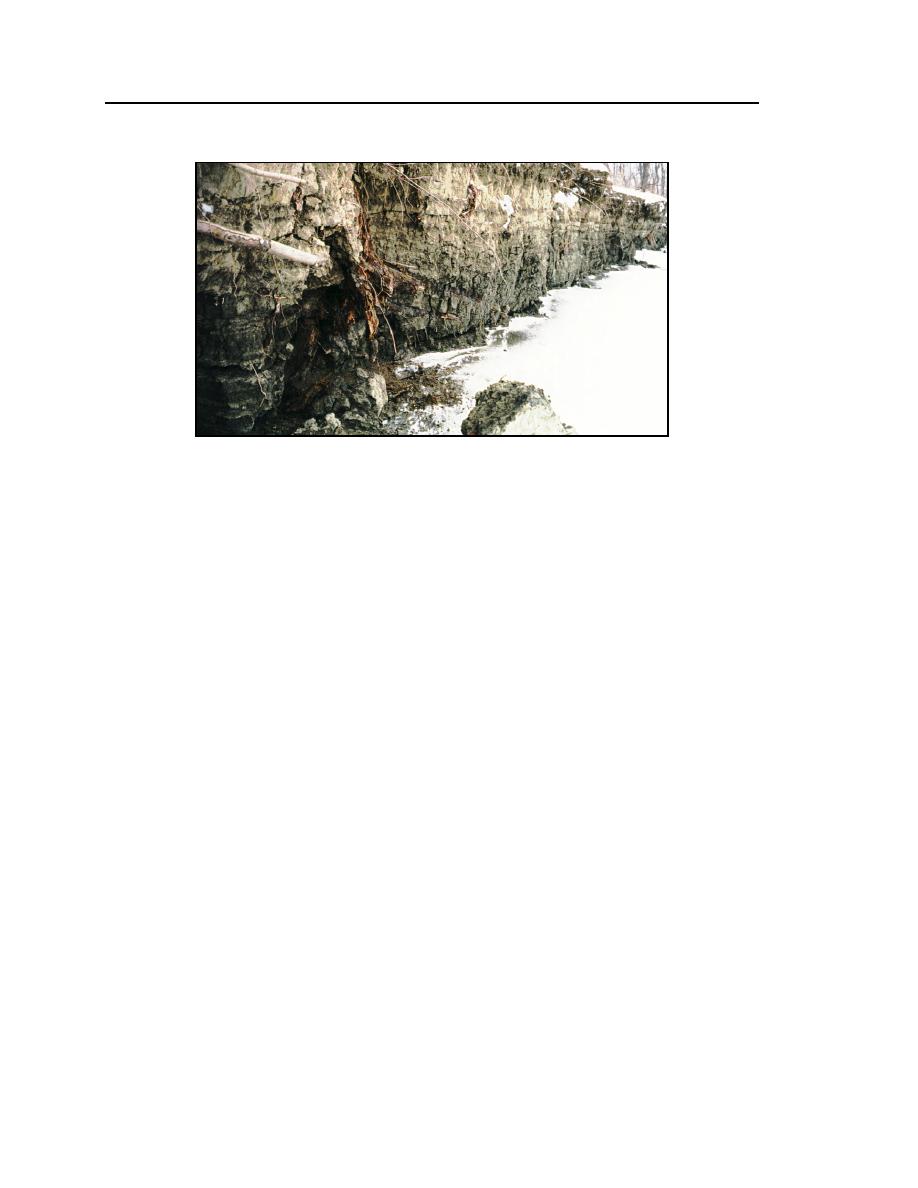
Figure 63. Crack development in the south riverbank at RM 1632.55.
The major instance of bank failure at the site occurred immediately after the
ice cover broke up and was flushed from the site. As the flow elevation dropped,
the combined effects of bed scour at the bank toe and weakening of the bank
material caused the bank to recede about 3 ft on average. As can be seen in
Figure 62d, once the ice cover had departed, the riverbend had migrated farther
downstream, so the flow impinged at an awkward angle against the bank.
Ice cover thickness
The ice cover formation progressed upstream through the site on December
21. As at the other sites, the cover was not uniformly thick but tended to be
thinner where the flow velocity was greater. By the time of the January survey,
the cover was 1522 in. thick over most of the site, though only about 15 in.
thick along the thalweg. At the upstream cross section, the cover was as little as 4
in. thick along the thalweg, indicating fairly recent closure. The greatest thick-
ness of ice (2832 in.) occurred in the middle of the site, perhaps reflecting an
accumulation of frazil ice. By the time of the February survey, the cover thick-
ness had become more uniform at about 2023 in. A narrow band of thicker ice
had developed along the outer bank of the bend at the upstream cross section
(RM 1632.68).
Bed profiles
The main change evident in the bed profiles is a lowering of the bed along
the toe of the outer bank of the riverbend. Figure 64 shows the bed profile
changes along cross section at RM 1632.55, where the bed lowered about 3 ft at


 Previous Page
