15
16
17
18
19
20
21
3.6
8
9
10
11
12
13
14
1.8
1
2
3
4
5
6
7
0
0
27
3
6
9
12
15
18
21
24
North (m)
21
22
23
24
25
26
27
28
29
30
3.6
11
12
13
14
15
16
17
18
19
20
1.8
1
2
3
4
5
6
7
8
9
10
0
0
27
3
6
9
12
15
18
21
24
North (m)
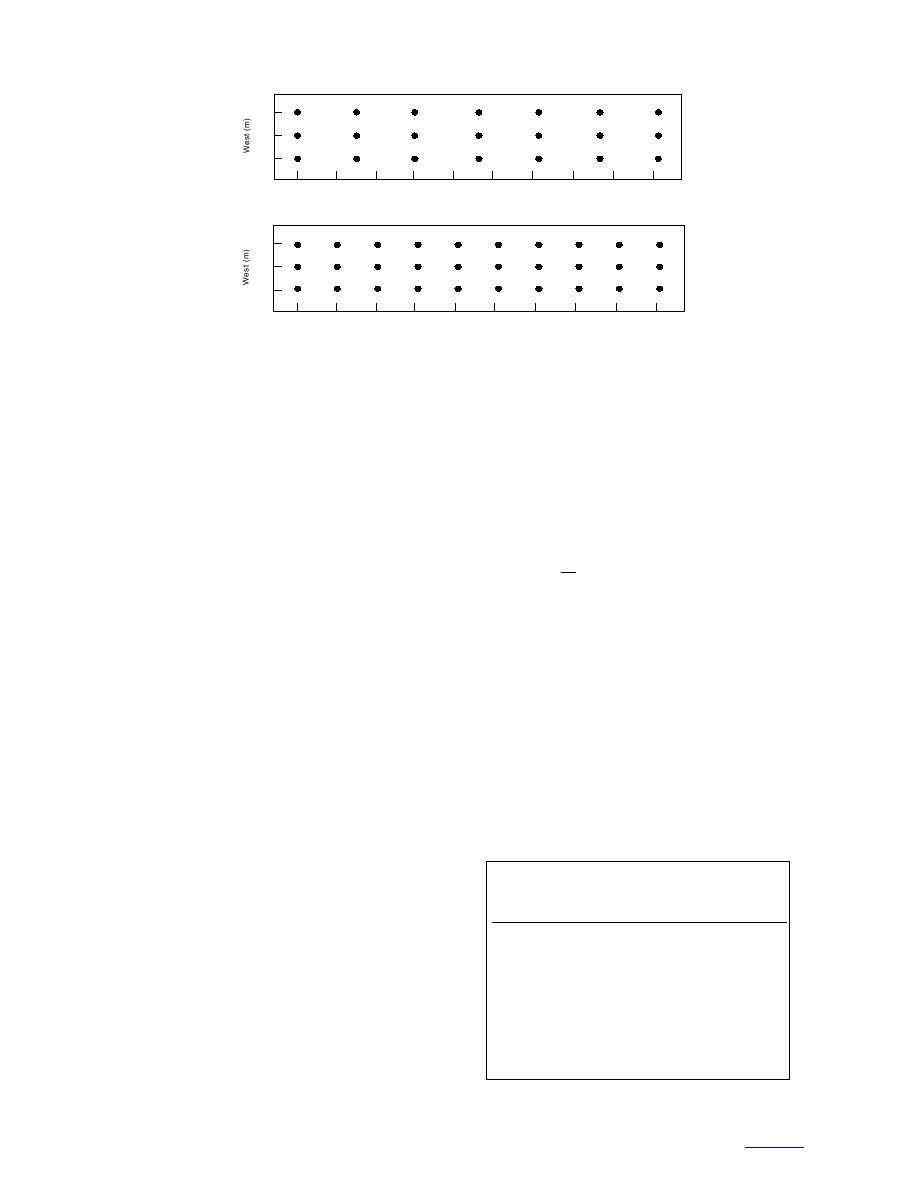
Figure 6. FERF grid sampling patterns.
with 2 m of relief. The major axis of the depression is
dard deviation and coefficient of variation (CV). The
oriented NW-SE. Thaw depth measurements were taken
ratio of standard deviation to the mean, eq 1, is often
along both the major and minor axis (Fig. 5) using frost
used to describe the distribution (i.e., the histogram)
tubes during spring 1991 and 1992.
(Isaaks and Srivastava 1989). A CV greater than one
The soil types present within the depression included
indicates the presence of some erratic sample values
loam, silty clay loam, and clay loam. Wheat was grown
and high variability in the data. A CV less than one
on this site in the spring of 1990 and 1991. The depres-
indicates low variability in the data set. Histograms of
sion was chisel-plowed after fall harvest (October) each
the thaw depth are displayed for each of the data sets.
year. Unlike the Alaska sites, this site is without perma-
σ
(1)
frost. The maximum soil frost depth of this site is 1.2
CV =
m
m, and average freezing period is 130 days.
where CV = coefficient of variation
σ = standard deviation
FERF
m = mean.
Thaw depths were collected in a controlled and
prepared freezethaw experiment in the FERF on a
Alaska North Slope
homogeneous soil compacted at specified moisture
Representative histograms from each of the sites in
content and density. This site is an indoor, temperature-
Alaska are shown in Figure 7 (all histograms are given
controlled environment that should reflect homogen-
in Appendix A). Statistical analysis for each of the thaw
ous soil conditions and eliminates the climatic, terrain,
depth measurement events for all data sets is given in
and solar radiation effects of the natural environment.
Tables 2 and 3. As mentioned earlier, there were miss-
Thaw depths were measured over the 100-square-meter
area by pushing a metal rod into the soil and were veri-
ing thaw depths on the grid because the point(s) or por-
fied by digging to the frost layer. Figure 6 shows typi-
tion of the grid was located on lakes, standing water,
cal grid spacings used for these measurements. (Some
rocks, and roads. Thus code 200 was used for lakes and
of the data sets were collected on a tighter grid than
others.)
Table 2. Thaw depth coefficient-of-variation
The soil type was characterized as silt. The dry den-
distribution for all sites.
sity of the soil varied from 1.39 to 1.70 g/cm3 and the
moisture content ranged from 20 to 30% (optimum
Sites
CV Range
Average CV
water content is 22%). The soil's maximum density
Atquasuk, Alaska
0.40.5
0.43
from the standard proctor test was 1.52 g/cm3 (Shoop
Barrow, Alaska
0.30.5
0.32
et al. 2000).
Betty Pingo, Alaska
0.3
0.33
Happy Valley, Alaska
0.20.4
0.28
Imnaviat Creek, Alaska
0.20.3
0.25
STATISTICAL ANALYSIS
Toolik Lake, Alaska
0.30.4
0.32
West Dock, Alaska
0.3
0.26
Thaw depths were analyzed to assess the distribu-
Fort McCoy, Wisconsin
0.5
0.45
tion of thaw as well as to determine the spatial effects.
Swan Lake, Minnesota
0.20.6
0.39
FERF, Hanover, N.H.
0.10.6
0.21
The statistical calculations include the average, stan-
5
to contents


 Previous Page
