Elmendorf Moraine, and Bootlegger Cove For-
These preliminary data allow us to begin assess-
mation or it has been eroded away. However, a
ing ground water movement and contaminant
dipping horizon like this is not supported by our
transport issues.
interpretation of the GPR data (Fig. 16).
Ground water maps (Fig. 15ac) (USACE
A more likely alternative is that cantonment
1996b) and data from recent ground water inves-
deposits result from a combination of these two
tigations on Elmendorf Air Force Base (USAF
scenarios, where the diamicton sheet to the south
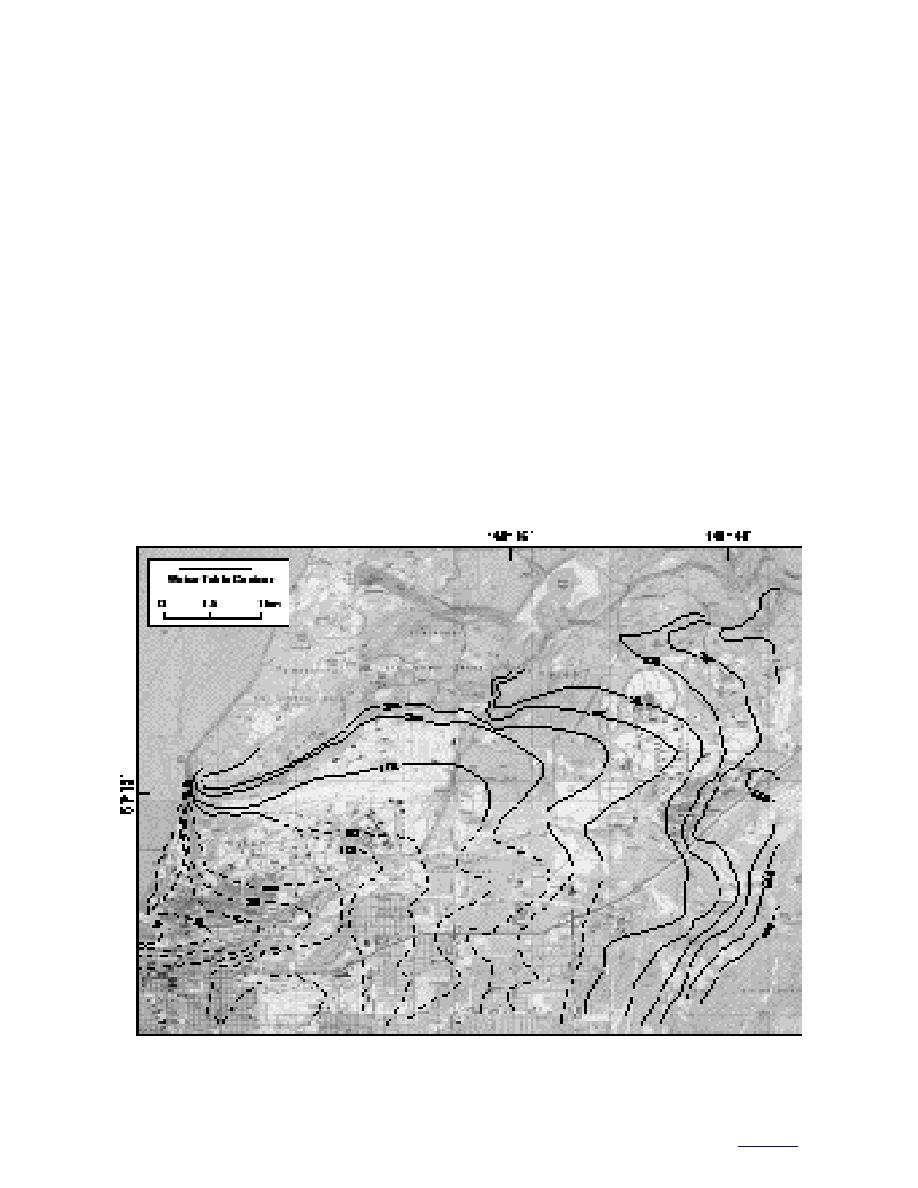
1994) (Fig. 18) allow us to compare these recent
was eroded by proglacial streams in front of the
results to the model proposed by Freethy (1976)
(Fig. 19). Flow lines on Figure 20 show conver-
Elmendorf Moraine (Fig. 17b) or dips to the
gent flow in the vicinity of the cantonment area,
north. Stream and fan deposits shed off of the
implying a flow boundary to the north, below the
moraine interfinger with gravel deposits in the
crest of the Elmendorf Moraine. This pattern was
fan. Blocks of relict diamicton may be locally bur-
ied in the gravel sequence, producing a complex
not supported by the USACE (1996b) report. The
architecture of interbedded diamicton and silty
ground water maps produced by the Alaska Dis-
outwash deposits.
trict imply that the surface of the unconfined
The U.S. Army Engineer District, Alaska
aquifer was dipping below the distal edge of the
(USACE 1996b), monitored 43 wells between 1994
moraine (wells AP-3471 and AP-3472; Fig. 15ac).
This area is, however, located at the outer limit of
and 1995, providing the first detailed look at
the USACE data and is therefore poorly defined.
ground water conditions in the cantonment area
Figure 20 compares the contrasting flow lines
on Fort Richardson. These data are augmented by
from the two models along the north edge of the
site-specific ground water data related to envi-
cantonment. We cannot resolve this discrepancy,
ronmental investigations (E & E 1996, ESE 1991).
Figure 19. Ground water level in the lower Ship Creek basin as determined by Freethy (1976). (Contours in feet, as
originally measured. To convert to meters, multiply by 0.3048.)
27
to contents


 Previous Page
