tion, as determined by a reference method, and,
Table 9. Percent recoveries and relative standard devia-
for one sample set, only greater than values (those
tions for performance evaluation materials analyzed dur-
above method calibration range) were reported for
ing the field trial.
both the HM 2000 and visual method. For the 13
Technology developer
remaining sample sets, the reference method and
CRREL
Visual
HM 2000
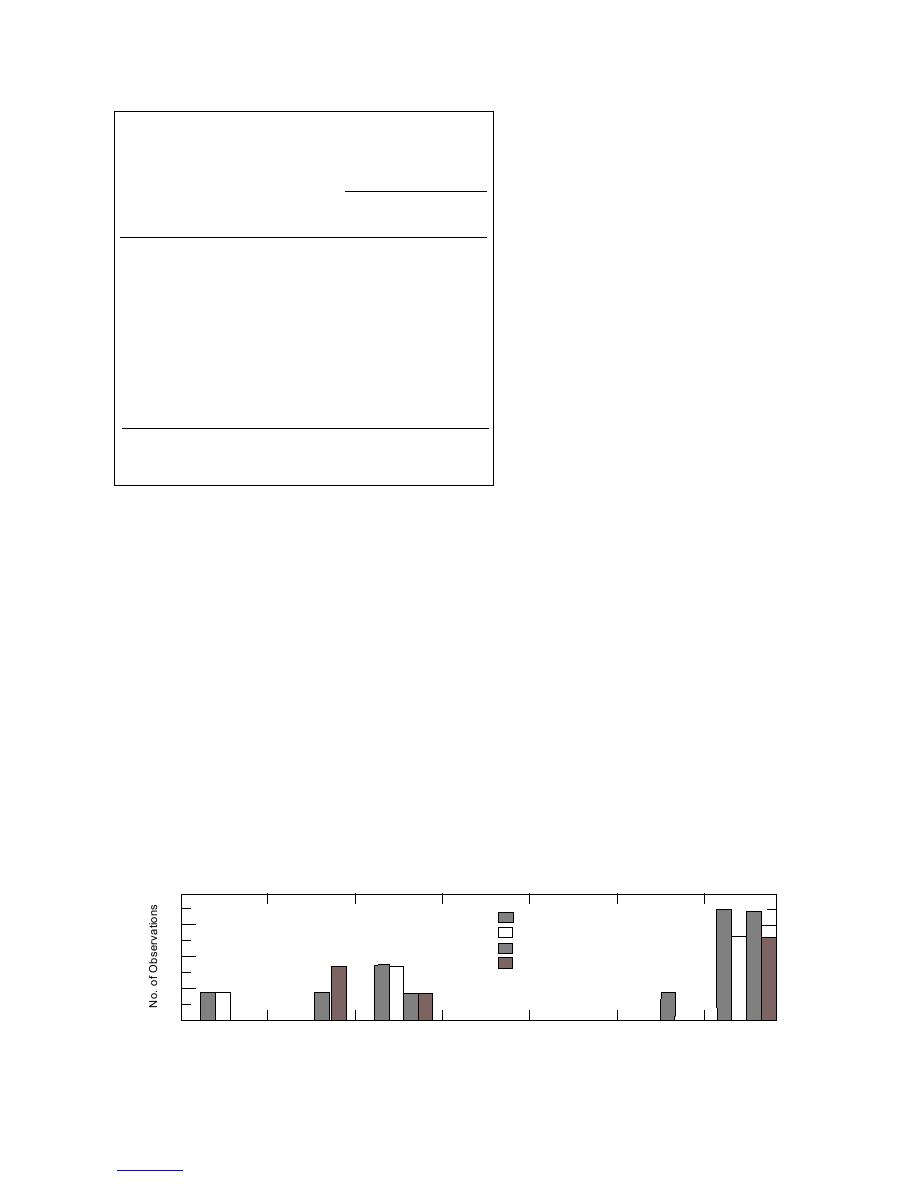
both the HM 2000 and visual results were com-
Sample
% Recovery % Recovery %Recovery
pared by looking at the percent difference (%D)
No./ID
(% RSD)*
(% RSD)
(% RSD)
among them (Fig. 2). For both matrices, at least half
1. Gasoline
the %D values were greater 100%, indicating that
Soil, SG-1, 2, 3 & 4
99
160
310
both the visual and HM 2000 methods tend to give
(200 mg TPH/kg)
(8.6)
(38)
results that are biased high, compared to the refer-
Water, WG-1, 2, 3 & 4
100
430
480
ence method.
(1.0 mg TPH/L)
(7.0)
†
2. Diesel
DISCUSSION
Soil, SDM-1, 2, 3 & 4
--
300
270
(401 mg TPH/kg)
(56)
The procedures developed for using the Hanby
Test Kits and HM 2000 to estimate the TPH con-
Soil, SDM-25, 26, 27 & 28
--
270
290
centrations in soil and water matrices are easy to
(2480 mg TPH/kg)
(35)
learn and use; however, some changes and im-
* % Relative standard deviation
provements are recommended. The current prac-
† Only two of the four replicates were analyzed; no estimate was
tice for collecting and preparing soil samples sus-
pected to be contaminated with gasoline must be
changed. The high vapor pressures (i.e., low boiling
and for one out of seven by the HM 2000 method (Table
points) of many of the hydrocarbons in gasoline make
10). However, in one instance, for the visual method,
the matrices contaminated with this petroleum product,
this was clearly fortuitous, as the replicate values dif-
particularly soils, susceptible to volatilization losses
fered by a factor of 3.9 (Appendix A, Table A1; SG-20
when samples are collected and prepared (Hewitt et al.
and -21). The reference method yielded an average TPH
concentration within 20% of the expected value for
1995). For this reason, to limit exposure during collec-
tion, a modified syringe or similar coring device should
three of the four duplicate sets analyzed (Table 10).
be used rather than a spoon or spatula. In addition, in-
For the PE samples, the %RSD ranged from 35 to
stead of adding a soil to a beaker, weighing, and then
56% for the HM 2000. In contrast, the %RSDs were below
adding the extraction solvent, as currently instructed,
10% for the reference method of analysis. The RPDs
soil samples should be transferred with special precau-
for the matrix spike sample duplicates and field sample
tions being taken to limit exposure, and placed directly
duplicates were also used to assess precision. For the
into VOA vials containing the appropriate extraction
matrix spikes, the RPDs ranged up to 140%, and were
solvent. This approach to handling soils contaminated
on average 35%, for the HM 2000 method; in contrast,
with gasoline was used in this study, and is consistent
with the reference method, they ranged up to 28%, and
with the guidance given in Method 5035 and D 4547-
were on average less than 10% (Table 10 and 11).
98 (U.S. EPA 1986, ASTM 1998).
Of the field samples, 11 co-located soil samples and
To reuse the cuvettes, the Friedel-Crafts aklyation
8 replicate water samples contaminated with gasoline
by-products (e.g., AlCl3) must be removed, and the ves-
were analyzed by the HM 2000, visual method, and a
reference method (App. A, Tables A1 and A2). Of these
sel washed and dried. However, when water is used to
19 sample sets, five had concentrations below detec-
rinse these by-products from the cuvettes, a reaction
4
Visual, Soil
3
Visual,H20
HM 2000, Soil
2
HM 2000, H20
1
0
100 to 51
50 to 26
25 to 0
0 to 25
26 to 50
51 to 100
> 100
Figure 2. Range of percent difference (%D) values for TPH in soil and water field samples obtained
by the visual and HM 2000 methods as compared to the reference method.
8


 Previous Page
