level of agreement was not obtained, that is, less than a
resulting from a Friedel-Crafts reaction could charac-
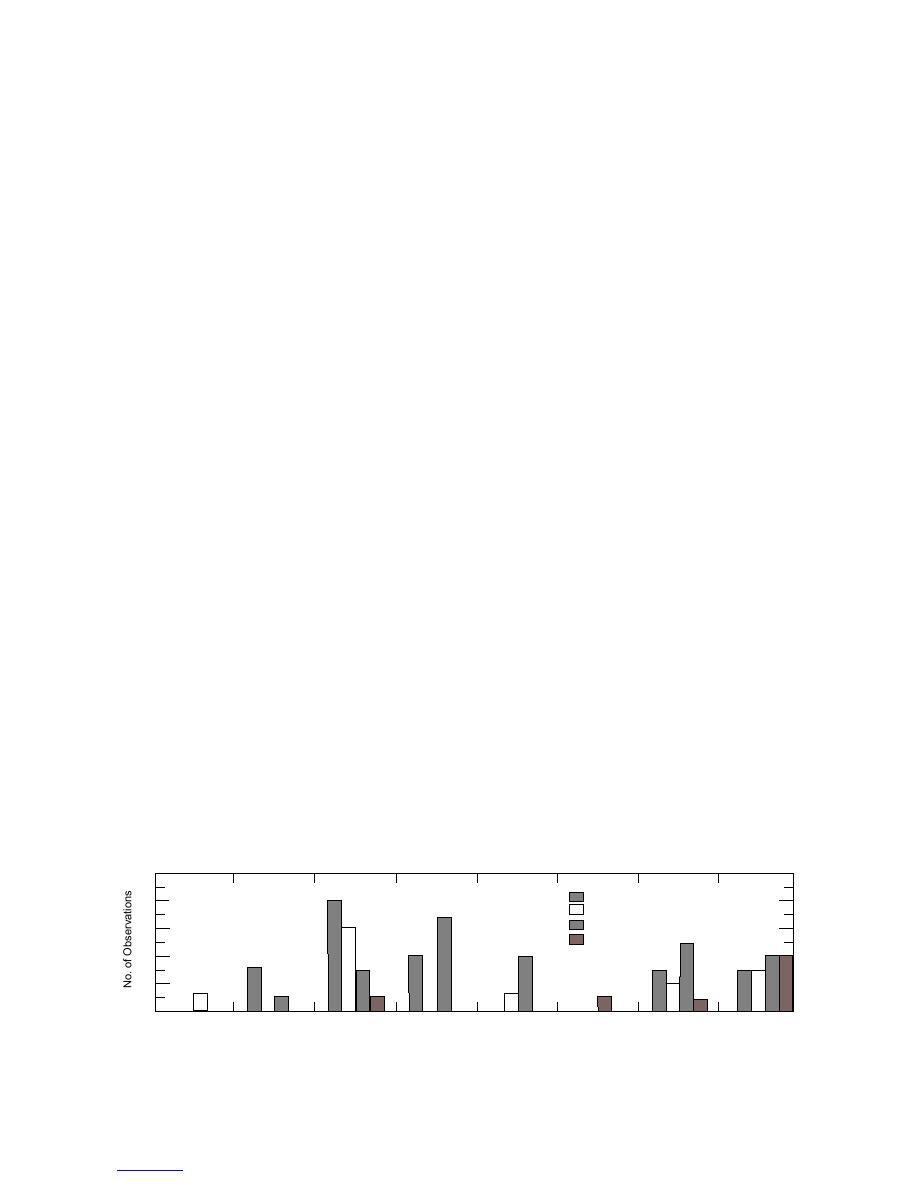
majority of values were within 50% (Fig. 2).
terize the type and amount of petroleum contamination
The Hanby Test Kits and the visual method of analy-
in environmental matrices. With respect to a qualita-
sis are currently recognized by the U.S. Environmental
tive interpretation, the HM 2000 spectrophotometer is
Protection Agency as a reliable field screening method
currently only capable of providing a spectral display
for TPH in environmental matrices. The highest data-
that must be interpreted subjectively and, therefore, it
quality level that has been assigned to these techniques
is no further advanced than the visual method of analy-
states that they are capable of producing TPH values
sis. For a quantitative estimate of a petroleum product,
that are within an order of magnitude of the true or
whether it is an individual compound or a mixture, as
accepted concentration (USEPA 1997). The perform-
in a fuel, an appropriate calibration model must be avail-
ance of the visual method of analysis for the PE and
able and selected before samples are prepared and anal-
matrix spike samples analyzed during both the labora-
yzed. When these requirements were met, results from
tory and field trials supports this classification, as there
laboratory and field trials for both the visual and HM
were no TPH values outside of this range. Indeed, there
2000 method of analysis were often similar for assess-
were only a couple of values for the visual method of
ing TPH contamination. When a data-quality level that
analysis that were a factor of 5 or slightly greater than
specifies that the TPH estimates must be within an order
the expected concentration. In comparison to the visual
of magnitude of the certified or expected value was
method of analysis, the HM 2000 yielded some values
applied, the HM 2000 yielded some values for water
that were false negatives and one that was greater than
samples that failed this criterion. This level of data qual-
the expected value by more than 10.
ity was appropriate for the visual method of analyzing
The detection limit for water samples for both the
both soil and water matices, and, for the HM 2000, with
visual and HM 2000 methods is claimed to be 0.1 mg
respect to soil samples. Aside from this, other claims
TPH/L (Hanby 1998). However, the MDL estimated
regarding the accuracy or detection limit of both the
during the laboratory trials was 2.3 mg TPH/L. Further-
visual and HM 2000 methods could not be substantiated.
more, all of the values given by the HM 2000 that either
The most troublesome finding of this evaluation, how-
were false negatives or that were more than 10 greater
ever, is that, currently, the HM 2000 system is prone to
than the expected concentration were for water samples
software related failures that interrupt routine opera-
spiked at a concentration below 1.0 TPH mg/L. The
tion. On the basis of these observations, findings, and
MDL estimated during the laboratory trials for a soil
the associated costs, the current HM 2000 system is
matrix (17 mg TPH/kg) was in reasonable agreement
not recommended for the characterization of petroleum
with the reported value (10 mg TPH/kg, Hanby 1998).
products in environmental matrices.
Since there was agreement for the detection limit with
respect to soils, and no false negatives or estimates
LITERATURE CITED
greater than 10 the expected concentration were
ASTM (1998) Standard guide for sampling waste and
observed for spiked soils, the HM 2000 system appears
soils for volatile organic compounds. D 4547-98. Amer-
to be better suited for this matrix.
ican Society for Testing and Materials, West Con-
shokocken, Pennsulvania.
SUMMARY
Federal Register (1984) Definition and procedure for
This study was undertaken to substantiate claims that
the determination of the method detection limit. Code of
a spectrophotometric analysis of the colored catalyst
Federal Regulations, Part 136, Appendix B, October 26.
10
Visual, Soil
8
Visual, H20
HM 2000, Soil
6
HM 2000, H20
4
2
0
100 to 57
50 to 26
25 to 0
0 to 25
26 to 50
51 to 100
> 100
> 100
Figure 2. Range of percent difference (%D) values for TPH in soil and water quality assurance samples
obtained by the visual and HM 2000 methods.
10


 Previous Page
