680
Legend
Legend
WS 15600 cfs - Plan 90
WSWS00 cf60Plans6
100 15s - 0 cf 8 -
Plan 90
WS 9000 cfs - Plan 86
WS 10000 cfs - Plan 86
15,600
WS 7000 cfs - Plan 84
WS 9000 cfs - Plan 86
670
cfs
Ground
WS 7000 cfs - Plan 84
7,000 cfs
Ground
9,000
cfs
660
10,000
cfs
ICS
650
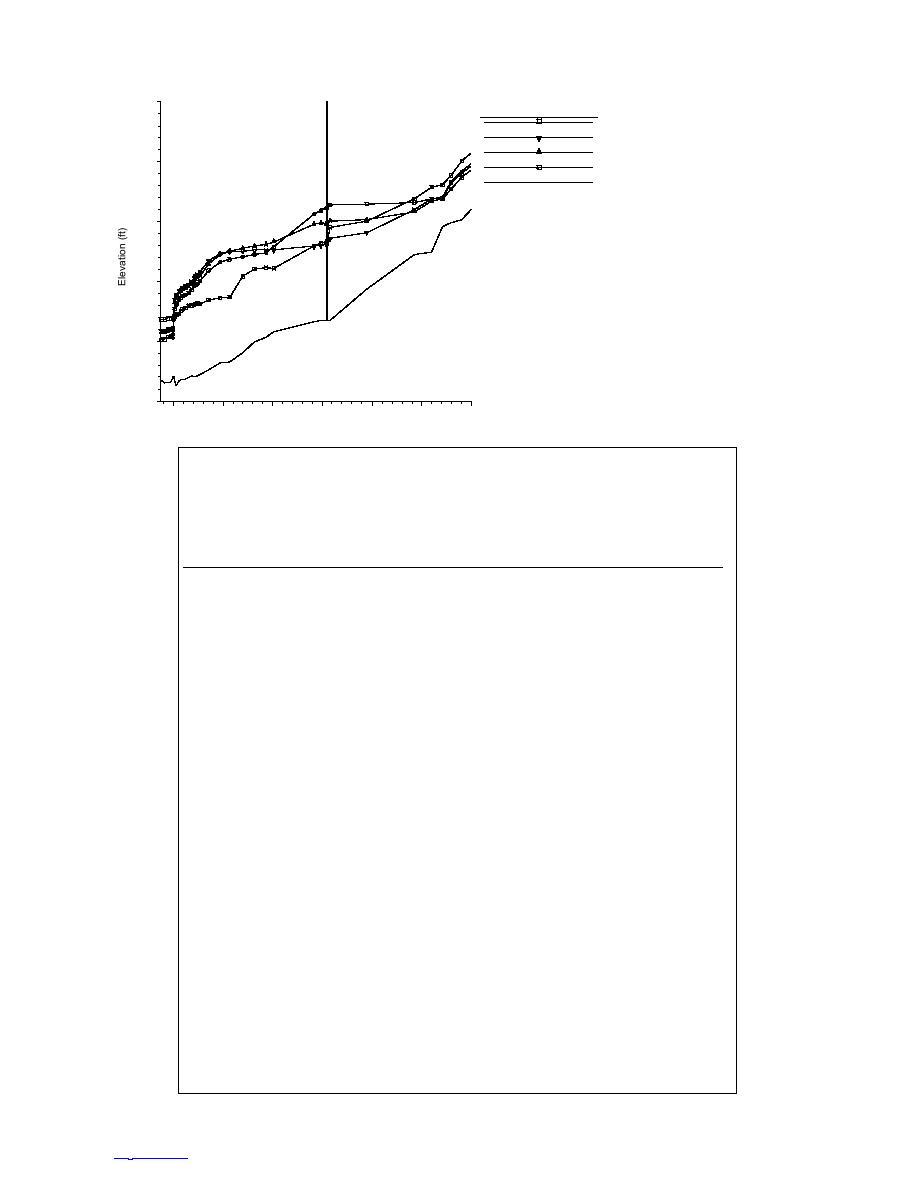
Figure 22. Maximum waterlevels expected upstream of
the ICS, showing the governing discharge for various sec-
tions of the river. All profiles are for ice jams except 15,600-
640
cfs profile (100-year open water).
630
0
2000
4000
6000
8000
10000
12000
Main Channel Distance (ft)
Table 6. Maximum waterlevels expected upstream of the ICS. Note that the ICS has no
effect beyond about 9600 ft upstream, where the 100-year open-water profile dictates maximum
waterlevels. The ICS is located at the site originally proposed for the weir-with-pier ICS (USACE
1986a, 1986b), identified as RS 337.27 in Cazpfe HEC-2 deck.
Distance
Maximum water
Governing
upstream of ICS
surface elevation
discharge
Open water or
(ft)
(ft-NGVD)
(cfs)
ice conditions
Landmark
15962
684.74
15600
Open-Water
13062
674.93
15600
Open-Water
11618
670.10
15600
Open-Water
Upstream House
11178
667.62
15600
Open-Water
Brady's House
10818
666.15
15600
Open-Water
10403
665.79
15600
Open-Water
Winspear Subdivision
9692
663.72
15600
Open-Water
Winspear Subdivision
7792
662.98
7000
Ice
6292
662.71
7000
Ice
6192
662.31
7000
Ice
Leydecker Rd
6164
662.23
7000
Ice
Leydecker Rd
5950
661.86
7000
Ice
Leydecker House
5650
661.23
7000
Ice
4037
656.64
9000
Ice
3727
656.13
9000
Ice
3252
655.86
9000
Ice
2782
655.52
9000
Ice
2247
655.00
9000
Ice
1892
654.58
10000
Ice
Kotecki Grove
1417
653.52
10000
Ice
Kotecki Grove
1080
651.66
10000
Ice
960
651.15
10000
Ice
897
650.98
10000
Ice
840
650.69
10000
Ice
720
650.02
10000
Ice
600
649.73
11000
Ice
480
649.50
11000
Ice
360
649.29
11000
Ice
299
648.96
11000
Ice
240
648.84
11000
Ice
132
648.10
11000
Ice
120
647.98
11000
Ice
50
647.13
11000
Ice
0
645.34
15600
Open-Water
ICS
20
TO CONTENTS


 Previous Page
