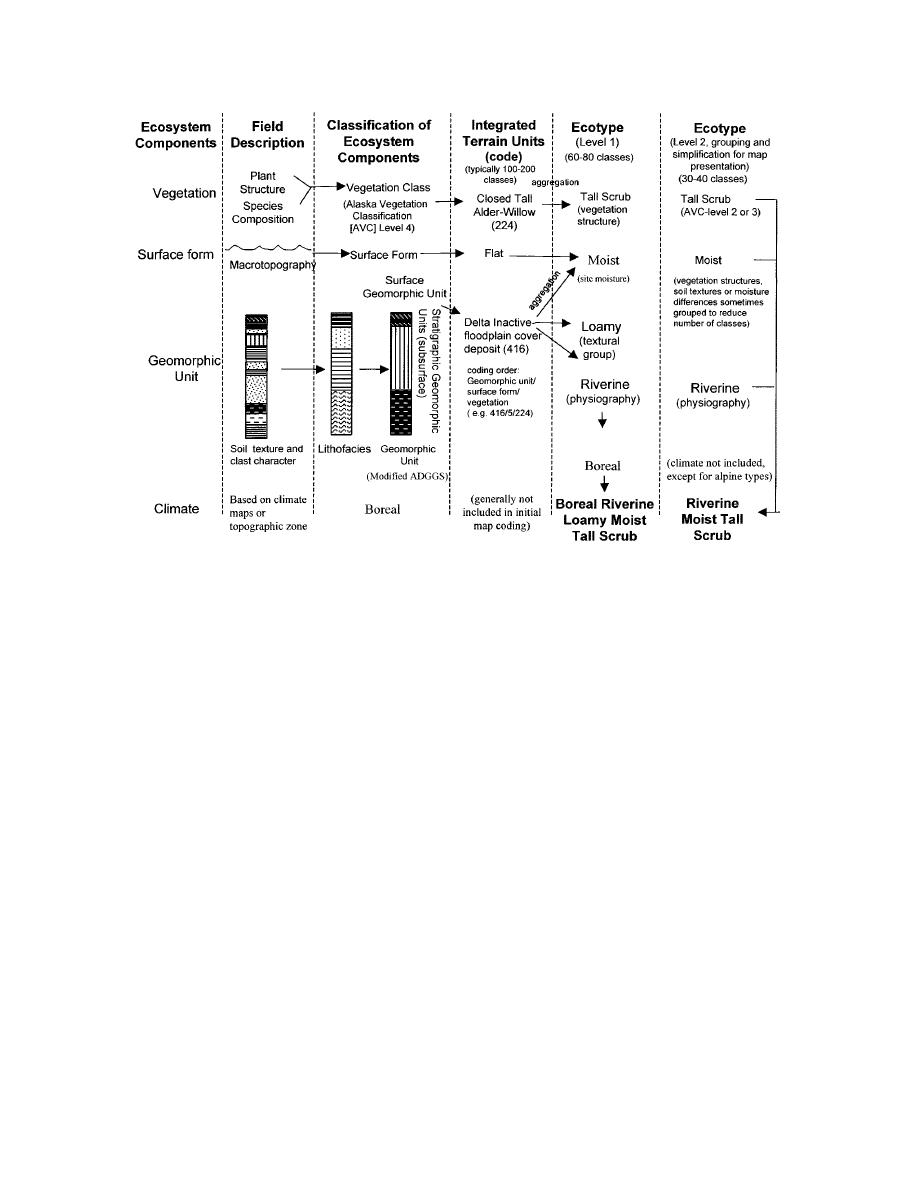
Figure 4. System of hierarchically classifying ecosystem components into integrated terrain units
(ITU) and further aggregating and simplifying ITUs into ecotypes.
tion of Landsat Imagery, geomorphology derived from
for their own individual purposes. Ground data can be
the ecosections map, and physiography from the digi-
reclassified and analyzed by regrouping characteristics
tal elevation model and ecodistricts map, we could in-
in Appendix A and applying the new organization to
tegrate several landscape components in a way that was
the plot database (Appendix B).
similar to the integrated-terrain-unit (ITU) method used
To classify ecosystems at smaller spatial scales, we
for mapping Fort Wainwright (Jorgenson et al. 1999).
used geomorphic and physiographic criteria (Table 2).
Ecosections were differentiated on the basis of their
Ecotypes
geomorphic patterns and processes, and we named them
Ecotypes were mapped by computer processing of
after geomorphic units. We classified ecodistricts and
Landsat TM imagery. The processing followed a series
ecosubdistricts on the basis of general physiographic
of sequential and iterative steps: acquiring data, cor-
characteristics that were related to associations of geo-
recting and classifying the image, using photo inter-
morphic units. Because each ecodistrict is unique, we
pretation techniques on it, developing conceptual mod-
named the areas on the basis of a general physiographic
els of ecological relationships, and developing a final
descriptor (e.g., lowland or highland) and a prominent
classification using a rule-based system that incorpo-
geographic feature (e.g., nearby creek or mountain).
rated ancillary data (Fig. 5).
Mapping
Data acquisition included compiling satellite imag-
ery, aerial photography, and other ancillary informa-
We mapped the ecosystems at three scales: ecotype
tion. The Landsat TM satellite image (Path 68, Row
(1:50,000), ecosection (1:100,000), and ecodistrict and
15), obtained on 10 August 1994, has a spatial resolu-
ecosubdistrict (1:250,000). The ecotype map was based
tion (pixel size) of 28.5 m. Aerial photography included
on the unsupervised classification of the spectral char-
complete coverage of 1979 and 1980 in color-infrared
acteristics of the Landsat Thematic Mapper (TM) im-
(1:63,000 scale) and 1996 in true color (1:24,000), and
agery and the ruled-based classification of spectral clus-
partial coverage of 1996 in true color (approximately
ters using ancillary data. The ecosection and ecodistrict
1:1000). The color-infrared photography was used for
maps were based on photo-interpretation. By incorpo-
mapping ecosections. We referred to the medium-scale
rating vegetation structure from the spectral classifica-
10


 Previous Page
