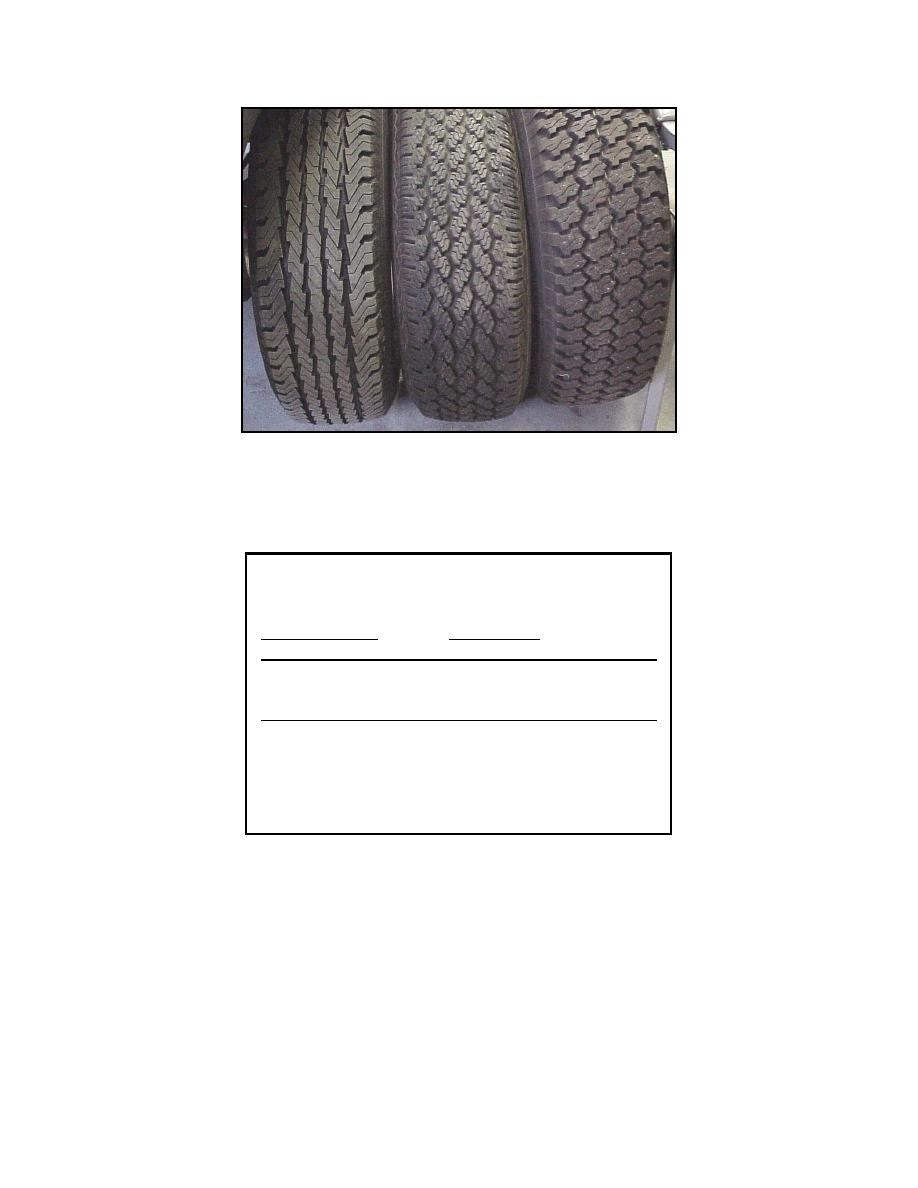
Figure 36. Tires used in the experiments: Goodyear Wrangler HT,
Michelin XCH4, and Goodyear Wrangler AT.
Table 6. Tire characteristics for the test tires at an average
vertical load of 6227 N (1400 lb). The XCH4 tire data were
used to represent the average values.
Inflation pressure
Deflection
Contact
Max. deflected
area (cm2)
(kPa)
(psi)
(cm)
(%)
section width (cm)
103
8
509.7
6.3
38
27.9
138
15
419.4
5.4
33
25.9
179
26
364.5
4.6
28
26.0
241
35
281.7
3.1
19
25.1
Unloaded tire diameter: 73.7 cm
Unloaded section width: 22.9 cm
Unloaded section height: 16.4 cm
Tread width: 15.7 cm
Ratio of voids to tread contact area: 0.44
Inflated overall section width: 24.9 cm
Inflated diameter: 74.7 to 75.3 cm
tween the different tires and models. Based on the
All three tires were evaluated for their deforma-
good match in the measured tire deformations on a
tion characteristics on a rigid surface. A comparison
rigid surface (deflection and contact area), the tires
of the deflection and contact area measurements col-
were assumed to be sufficiently similar for inter-
lected from various sources is given in Figures 37
changeable use in comparing to model results. The
and 38. All of the data were collected after a tire
normal operating pressure for the tires is 241 kPa (35
break-in period of operation of at least 160 km. Con-
psi), and that is where the similarity between models
tact area is calculated from a static contact "perime-
and data is best.
ter" area without accounting for voids due to tread
pattern so that comparisons can easily be made be-
25


 Previous Page
