600
400
200
a. Axial stress
0
50
100
150
0
Time (seconds)
600
400
200
b. Displacement.
0
50
100
150
0
Time (seconds)
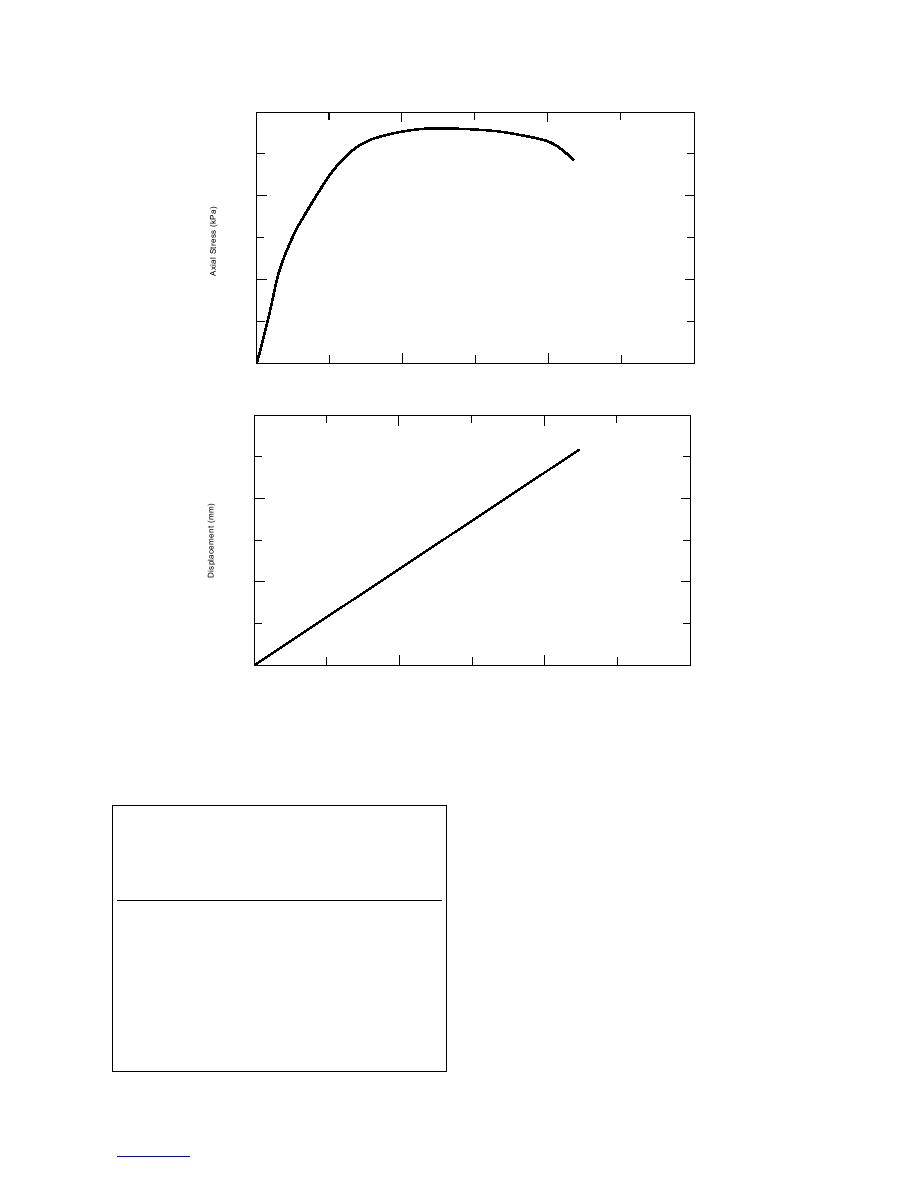
Figure 19. Typical measurements (100% natural, σ3 = 73 kPa).
to shift upward on the same curve as the 36 kPa, unlike
Table 12. Shear strength material properties from
the distinct difference seen with the 150-mm-diameter
large-scale tests (300-mm φ).
sample results (Fig. 22).
Test
The effect of void ratio and percentage of crushed
σ3f
(τmax)f
(%
Void
c
material in the aggregate mixture on the mixture's shear
φ
crushed)
ratio
(kPa)
(kPa)
(kPa)
strength is presented in Table 14 and Figure 23. For the
(51)
300-mm samples, shear strength decreases rapidly with
100 (rep 1)
0.158
35
279
100 (rep 2)
0.089
73
560
increasing void ratio. A similar but less rapid response
51
75 (rep 1)
0.155
37
273
51
than that seen with the 300-mm-diameter samples is
75 (rep 2)
0.158
69
385
seen with the 150-mm samples when the confining pres-
50
50 (rep 1)
0.190
34
151
15
sure is 70 kPa. At the lower confining pressure of 36
50 (rep 2)
0.147
72
273
50 (rep 3)
0.115
37
339
kPa, shear strength is unaffected by the void ratio (Fig.
25 (rep 1)
0.159
37
283
23). As with the maximum shear stress, the correlation
25 (rep 2)
0.085
70
578
between the percent crushed aggregate and shear strength
31
0 (rep 1)
0.137
33
265
129
is poor (Fig. 23).
0 (rep 2)
0.129
73
308
16


 Previous Page
