60
0
75
50
75
25
100
50
40
0
20
300-mm Samples
150-mm Samples
0
0.000
0.050
0.100
0.150
0.250
0.200
0.300
Void Ratio
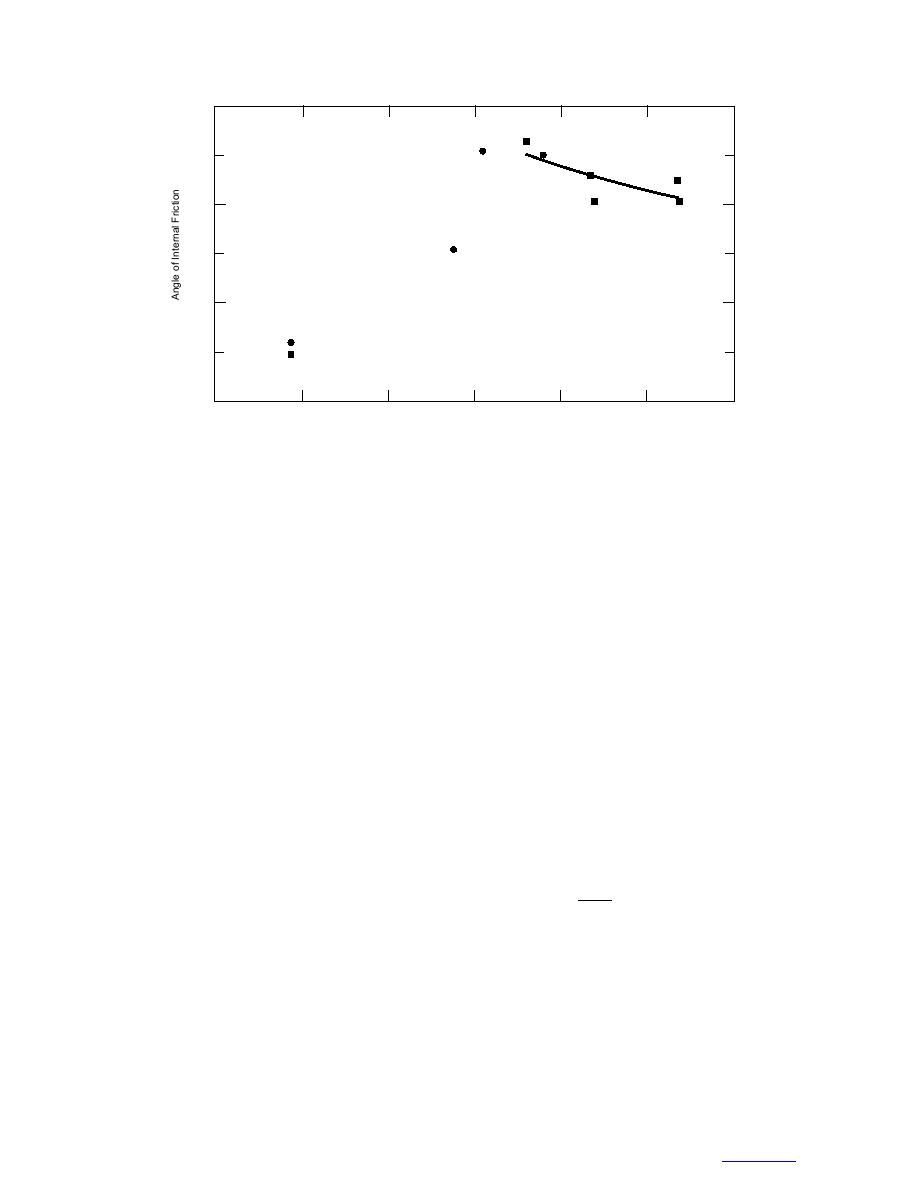
Figure 24. Effect of void ratio on the angle of internal friction.
Approximately 23 kg of aggregate was required for the
original PI required that aggregates be separated into
test. From the 23-kg sample, we were able to get approx-
three sizes: passing the 3/4-in. and retained on the 1/2-
imately 6 kg of aggregates, which were separated into
in. sieve; passing the 1/2-in. and retained on the 3/8-in.
coarse and fine fractions. Coarse aggregates passed the
sieve; and passing the 3/8-in. and retained on the No. 4
38-mm sieve but were retained on the 4.75-mm sieve.
sieve. For each size, the test involves tamping uniform
Fine aggregates passed the 4.75-mm sieve but were
aggregates into a mold in three equal layers using a
retained on the 0.6-mm sieve.
standard tamping rod with 10 strokes per layer. The
The coarse aggregates were compacted in three equal
process was repeated with 50 strokes per layer. Based
layers in a steel cylindrical mold with an inside diame-
on the percentage of voids at two compaction levels, PI
ter of 150 mm and an inside height of 178 mm (Fig.
was calculated from
26). The layer had ten drops evenly distributed over
PI = 1.25V10 - 0.25V50 - 32
(11)
the surface. The compaction effort was applied through
a rounded rod with a hemisphere diameter of 16 mm
where V10 = % voids in aggregates, 10 strokes per layer,
and a length of 610 mm. Each drop was made by hold-
and V50 = % voids in aggregates, 50 strokes per layer.
ing the rod vertically with its rounded end 51 mm above
Details on the development of the test method can
the surface of the aggregate. At the end of the third
be found in Huang (1965) and Janoo (1998).
layer compaction, the aggregate and mold was weighed
Breaking the aggregates into various particle sizes
and the amount of coarse aggregate to fill the mold was
is time consuming and expensive. A study conducted by
determined.
Michigan Transportation Commission (1983) showed the
From the weight, the volume of voids was calculated
following:
from
1. PI was more dependent on the aggregates' geo-
metric properties than on gradation. PI values were sig-
W
nificantly higher for crushed than for natural aggregates.
V10 = 1 - 10 100
(12)
2. PI tests conducted on the total mixtures produced
GsbV
similar relative differences between crushed and natu-
where V10 = % voids in aggregates at 10 strokes per
ral aggregates (Fig. 25).
layer
3. The PI showed less variation if based on the voids
W10 = average weight of aggregates in the mold
from the 10-blow compactive effort. The additional 50
Gsb = bulk dry specific gravity
blows were unnecessary.
V = volume of mold, mL.
Based on the results from the Michigan study, we
decided to use the modified Michigan Test Method for
Based on the Michigan study, the modified PI is esti-
determining PI. Tests were conducted on the 0, 25, 40,
mated from Figure 27 or from
50, 60, 75, and 100% crushed aggregate mixtures.
19


 Previous Page
