16
14
Crushed Aggregate
12
10
Natural Rounded Aggregate
8
Whole
Sample
6
4
2
6.3
6.3 - 95
95 - 13
13 - 19
19 - 25
25
Gradation of Samples (mm)
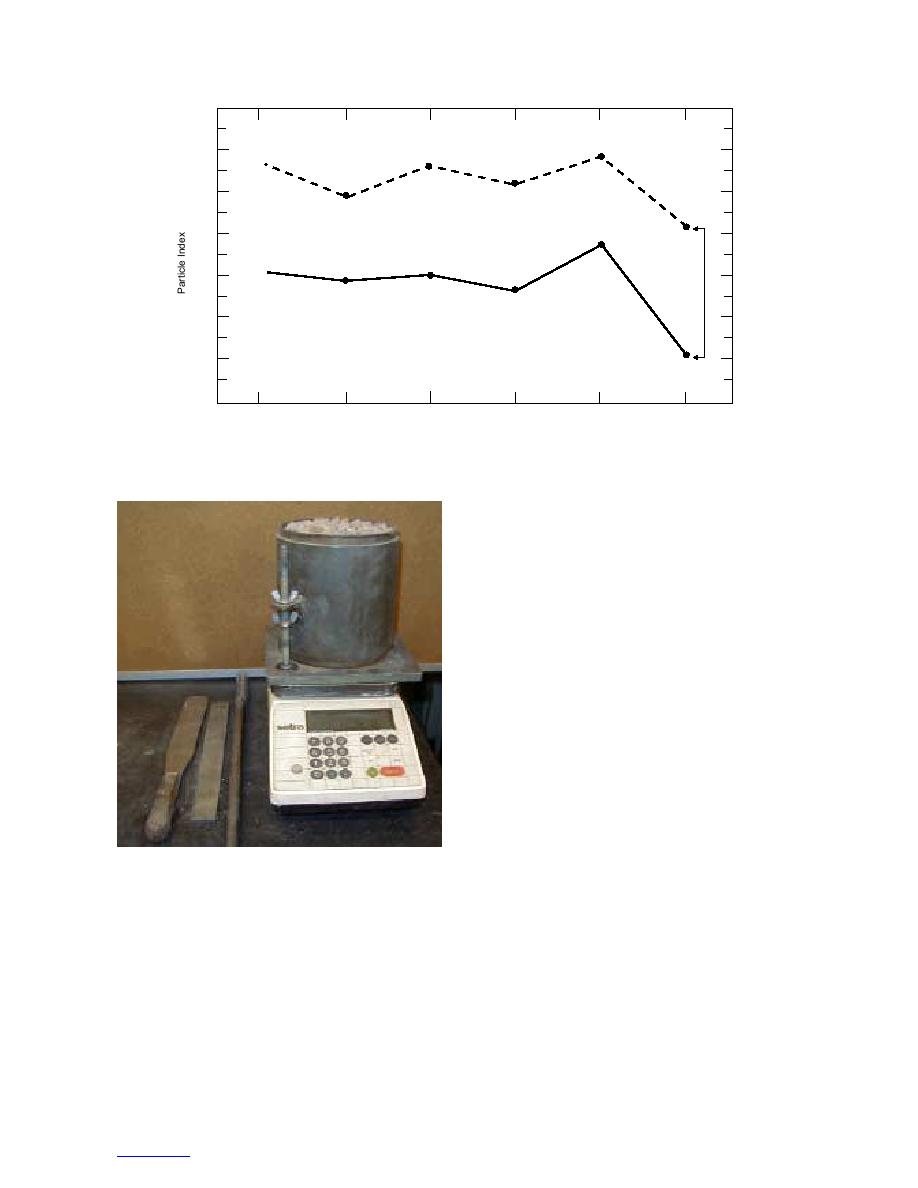
Figure 25. Particle index for different aggregate gradations. (After Michigan Transporta-
tion Commission 1983)
vided by VAOT are shown in Figure 28. The results
were significantly different and therefore warranted
additional investigation.
A check was made on the percentage of the angular
aggregates in the various mixtures. This was done visu-
ally using ASTM Standard D-2488, Visual Identifica-
tion of Aggregate Angularity. The angularity of coarse
aggregate is described as either angular, subangular,
subrounded, or rounded. Additional details of this test
procedure can be found in Janoo (1998). Visual inspec-
tions were conducted on the 0, 40, 50, 60, and 100%
crushed aggregates mixtures. Examples of the differ-
ent angularities of the test aggregates are shown in Fig-
ure 29. The results of the percent angularities in the
three mixtures are presented in Figure 30.
For the 100% crushed aggregate mixture, we found
that 82 of the aggregates were either subangular or angu-
lar. However, 18% consisted of subrounded aggregates.
There were no rounded aggregates in the mixture. For
the natural aggregates (0% crushed), there was an almost
5050 split in angular and round aggregates. The round
Figure 26. Particle index test mold.
and subrounded aggregates equaled 52%, with the
remainder almost equally split between subangular and
angular aggregates. For the 5050 mixture, the split was
PI = 0.983V10 30.
(13)
40% round and subrounded, and 60% angular and sub-
angular aggregates. The percentage of round and sub-
Test results, presented in Appendix C, are from the
round material in the 40/60 crushed/natural aggregate
aggregates shipped from ERDC/GSL after the comple-
mixture turned out to contain 60% angular material and
tion of the resilient modulus and shear tests. However,
the 60/40 crushed/natural aggregate mixture turned out
additional tests were conducted on other natural and
crushed aggregates. These results are presented in Table
to contain 80% angular material. Based on this investi-
C1. Results from the first batch of aggregate samples
gation, there is a difference between crushed aggregates
and from additional tests done with 40 and 60% crushed
and angular aggregates. Angular materials may occur
aggregate mixtures on a second batch of material pro-
naturally, and basing the angularity of aggregates on per-
20


 Previous Page
