1000
100%
25%
0%
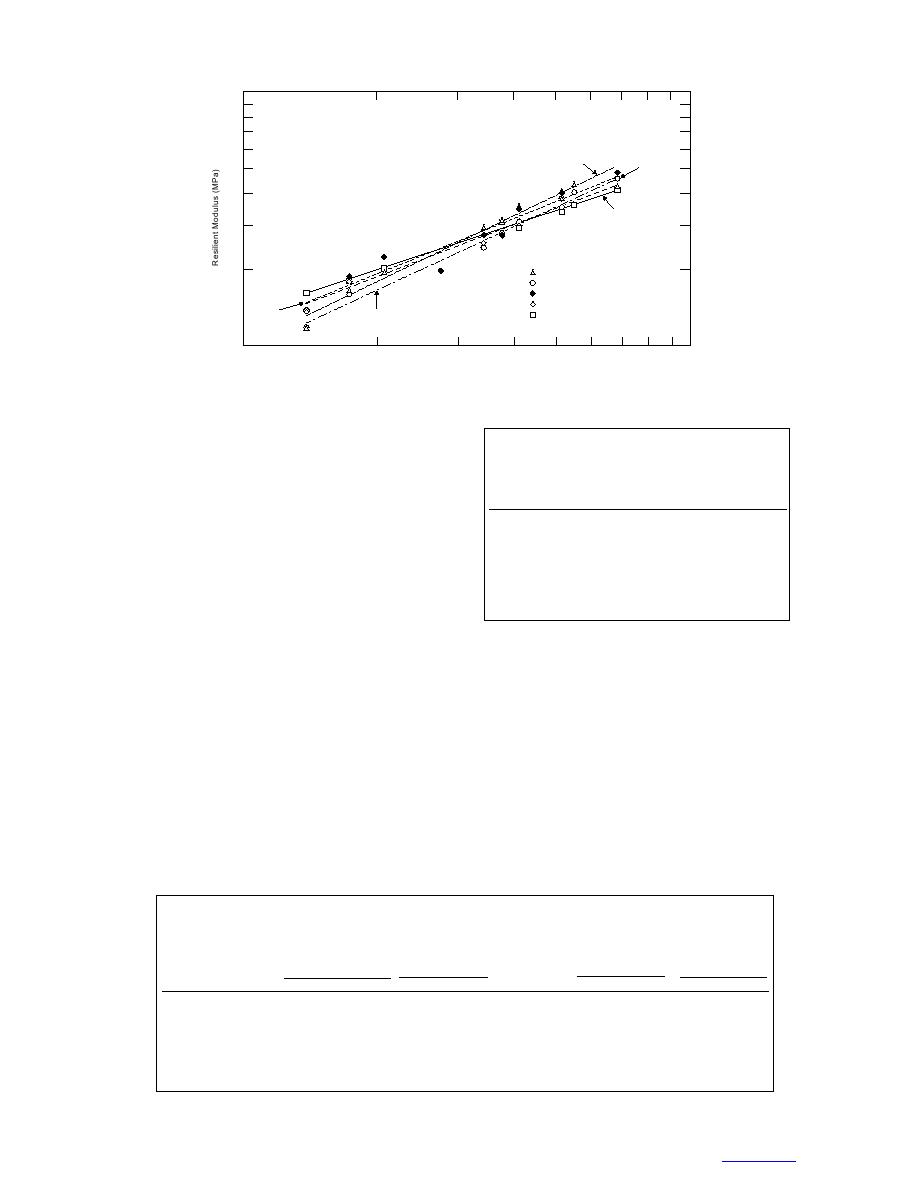
100% Crushed (e = 0.158)
75% Crushed (e = 0.155)
50% Crushed (e = 0.152)
25% Crushed (e = 0.158)
50%
0% Crushed (e = 0.137)
75%
100
100
1000
Bulk Stress, θ (kPa)
Figure 15. Resilient modulus as a function of bulk stress and aggregate angularity.
the reverse is true. The difference between the resilient
Table 8. Regression coefficients k1 and k2 for
modulus for crushed and natural material is small,
(Mr θ) model (300-mm-diameter samples).
approximately 10%. This small difference can be attrib-
%
uted to the low deviator stresses used and, in turn, the
R2
crushed
Void ratio
k1
k2
materials are in the linear range. In conclusion, the effect
of crushed material in a base course mix may not be
100
0.089 0.158
4.2517
0.7248
0.99
75
0.157
1.9928
0.8494
0.96
significant.
50
0.115
9.9406
0.6217
0.87
For the
50
0.190
1.7019
0.8075
0.96
25
0.158
5.2811
0.6753
0.98
Mr = k1θk2 (MPa)
(10)
0
0.129
8.4134
0.6769
0.92
0
0.137
9.2203
0.5814
0.99
model, coefficients k1 and k2 (Table 8) were obtained
COV of 8%.
from a regression analysis using a power function.
Average density of the large-scale samples was 2316
A similar analysis was conducted with results from
kg/m3, whereas average density of the 150-mm-diameter
the 150-mm-diameter test samples (Fig. 16). The opti-
samples was 2179 kg/m3, a difference of approximately
mum and test densities, relative densities, target mois-
6%. In both cases, moisture content was on the dry side
ture contents, and void ratios for the various test sam-
of optimum. Average void ratios of the large-scale and
ples are presented in Table 9. Our target density was
150-mm-diameter samples were 0.143 and 0.220,
the optimum density from T-99. The relative compac-
respectively.
tion of the test specimens ranged between 1.01 and 1.03,
Average resilient moduli from the two tests are pre-
with most around 1.03. The average density of all test
samples was 2179 kg/m3 with a coefficient of variation
sented in Table 10. Individual test results are presented
in Appendix B. Strain measurements at the 21-kPa con-
(COV) of 2.2%. Target moisture contents ranged from
fining pressure and 21-kPa deviator stress were in most
4.0 to 5.1% as shown in Table 9. Void ratios ranged
cases extremely noisy and were not used in the analy-
from 0.180 to 0.268 with an average of 0.220 and a
Table 9. Test sample densities, moisture contents, and void ratios (150-mm-diameter sample).
Target
Optimum
Optimum
moisture
density Test density (kg/m3) Relative density
%
moisture
content (%)
Void ratio
(kg/m3)
crushed
Rep 1
Rep 2
Rep 1
Rep 2
content (%)
Rep 1
Rep 2
Rep 1 Rep 2
100
2030
2090
1.03
4.0
4.6
0.268
75
2129
2178
2153
1.02
1.01
5.1
4.9
5.1
0.217
0.231
50
2118
2174
2153
1.03
1.02
4.7
4.7
4.7
0.219
0.231
25
2100
2157
2170
1.03
1.03
4.9
5.1
4.9
0.267
0.221
0
2187
2245
2232
1.03
1.02
4.6
4.0
4.0
0.180
0.187
0
2187
2243
1.03
4.6
4.0
0.182
13


 Previous Page
