250
200
150
100
50
0
96
98
100
102
104
Time (seconds)
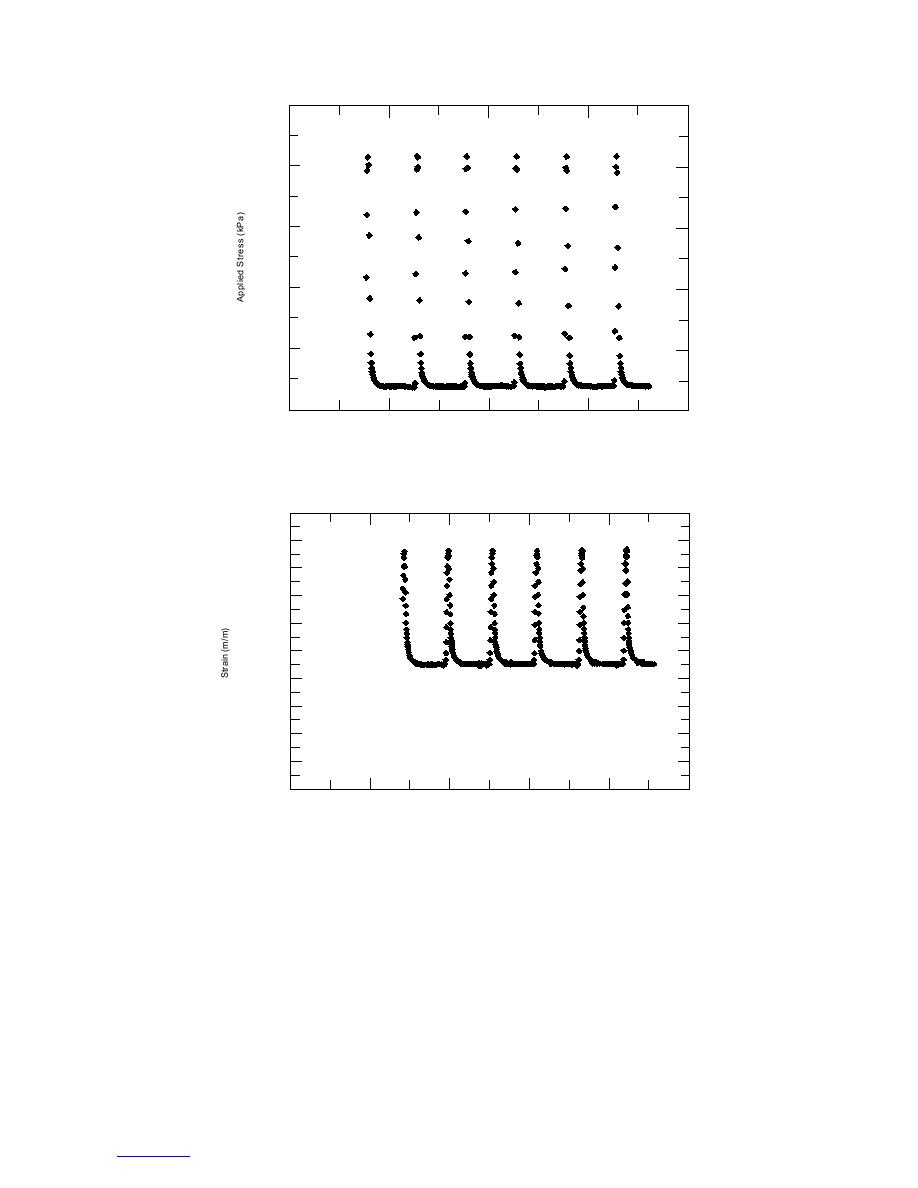
Figure 12. Applied stress measurement during resilient modulus test.
0.0020
0.0018
0.0016
0.0014
0.0012
0.0010
0.0008
0.0006
0.0004
0.0002
0
95
96
98
100
102
104
Time (seconds)
Figure 13. Corresponding strain measurement during resilient modulus test.
where σ1 and σ3 are the major and minor principal stress-
15. Resilient modulus for the 50% crushed aggregate
es and σd is the deviator stress, which is equal to the
is an average of the resilient modulus obtained at void
difference of the major and minor principal stresses.
ratios 0.115 and 0.190. It is assumed that the response
Changes in resilient modulus as a function of bulk
of the 50% crushed aggregate at a void ratio of 0.152 is
stress are shown in Figure 14. The effect of void ratio
a linear interpolation between the two tests.
(density) on resilient modulus is at most minimal for
As seen in Figure 15, angularity somewhat influ-
the 100% crushed aggregates (Fig. 14a). The effect of
ences the resilient modulus. At low bulk stresses, the
void ratio on resilient modulus can be seen with the
difference between the natural material's resilient mod-
50% and 0% crushed aggregates (Fig. 14c, e).
ulus is about 30% higher than the crushed material's
A summary of resilient modulus as a function of bulk
resilient modulus. At bulk stresses higher than 300 MPa,
stress at near-constant void ratio is presented in Figure
10


 Previous Page
