100
80
60
40
20
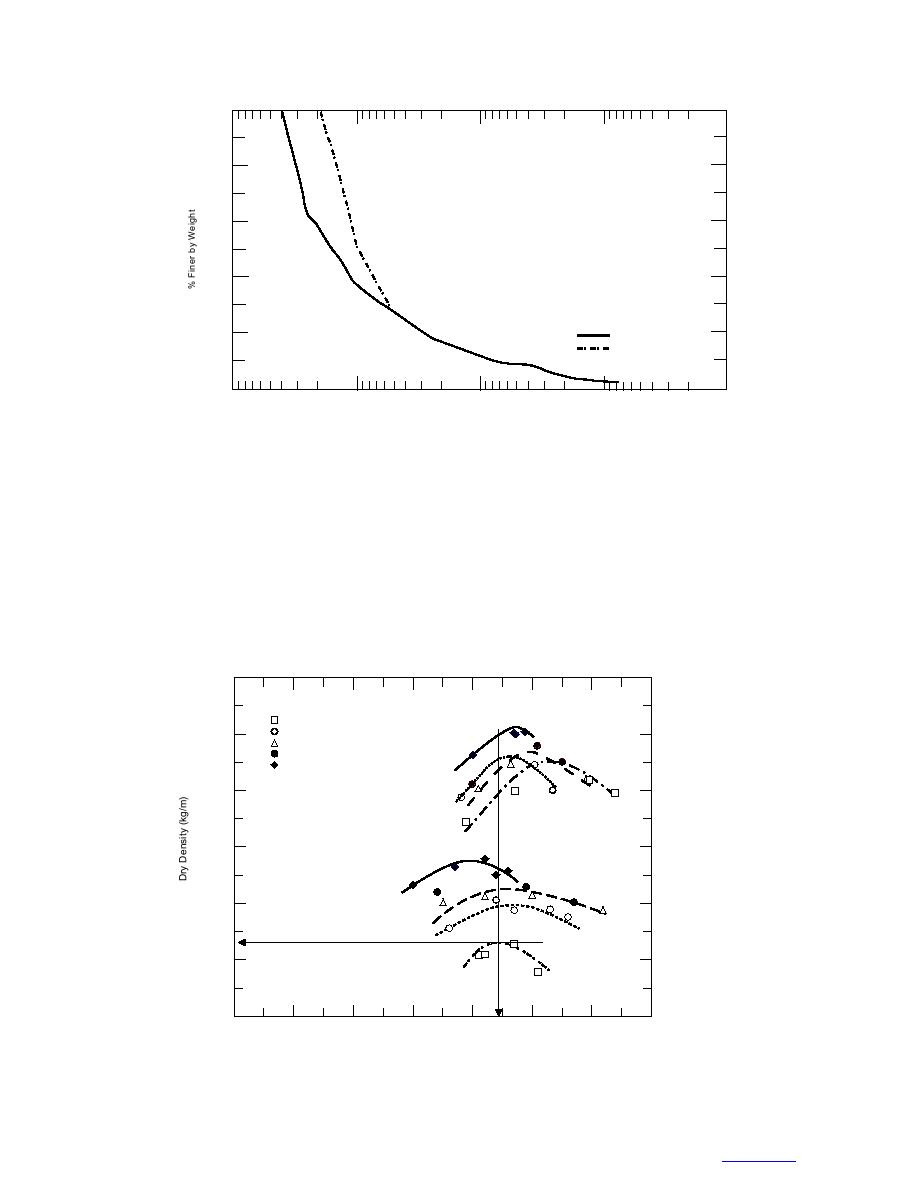
Original
AASHTO T-99
0
100
10
1
0.1
0.01
Grain Size (mm)
Figure 5. Gradation of subbase aggregate used in the AASHTO T-99 test.
five lifts and each lift was compacted with 56 rammer
procedure was modified to simulate the impact energy
blows. Test results are presented in Figure 6.
from the AASHTO T-99 test. The material was placed
A similar set of moisture density tests was conducted
in three lifts and each lift was compacted with a 15-kg
by CRREL using the test aggregate (Fig. 5) in a larger
rammer at a drop height of 450 mm (Fig. 7). The mold
mold (300-mm diameter) at the Quebec Ministry of
sat on a rotating base and rotated as the layer was com-
Transportation (QMOT) materials research laboratory
pacted. Each layer was tamped 60 times. After the third
in Quebec City (see Fig. 6). The test procedure was
layer, the material was leveled and weighed, collected
initially set up to simulate impact energy similar to that
in a tray, and weighed again. It was then dried in the
from the Modified Proctor Tests. For these tests, the
oven overnight.
2500
100% Crushed
75% Crushed
2400
50% Crushed
25% Crushed
100% Natural
LARGE
2300
SCALE
2200
2100
2000
T99
1900
0.0
1.0
2.0
3.0
4.0
5.0
6.0
7.0
Moisture Content (%)
Figure 6. Moisture density curves from T-99 and QMOT tests.
5


 Previous Page
