Table 4. Optimum moisture densities from AASHTO
T-99 and QMOT tests.
From T-99
From QMOT
Moisture
Dry
Moisture
Dry
content
density
content density
(kg/m3)
(kg/m3)
Test material
(%)
(%)
100% Natural
4.2
2180
4.9
2404
75N - 25C
4.9
2129
5.1
2381
50N - 50C
4.8
2117
4.6
2349
25N - 75C
5.1
2091
5.0
2346
100% Crushed
4.6
2028
6.0
2319
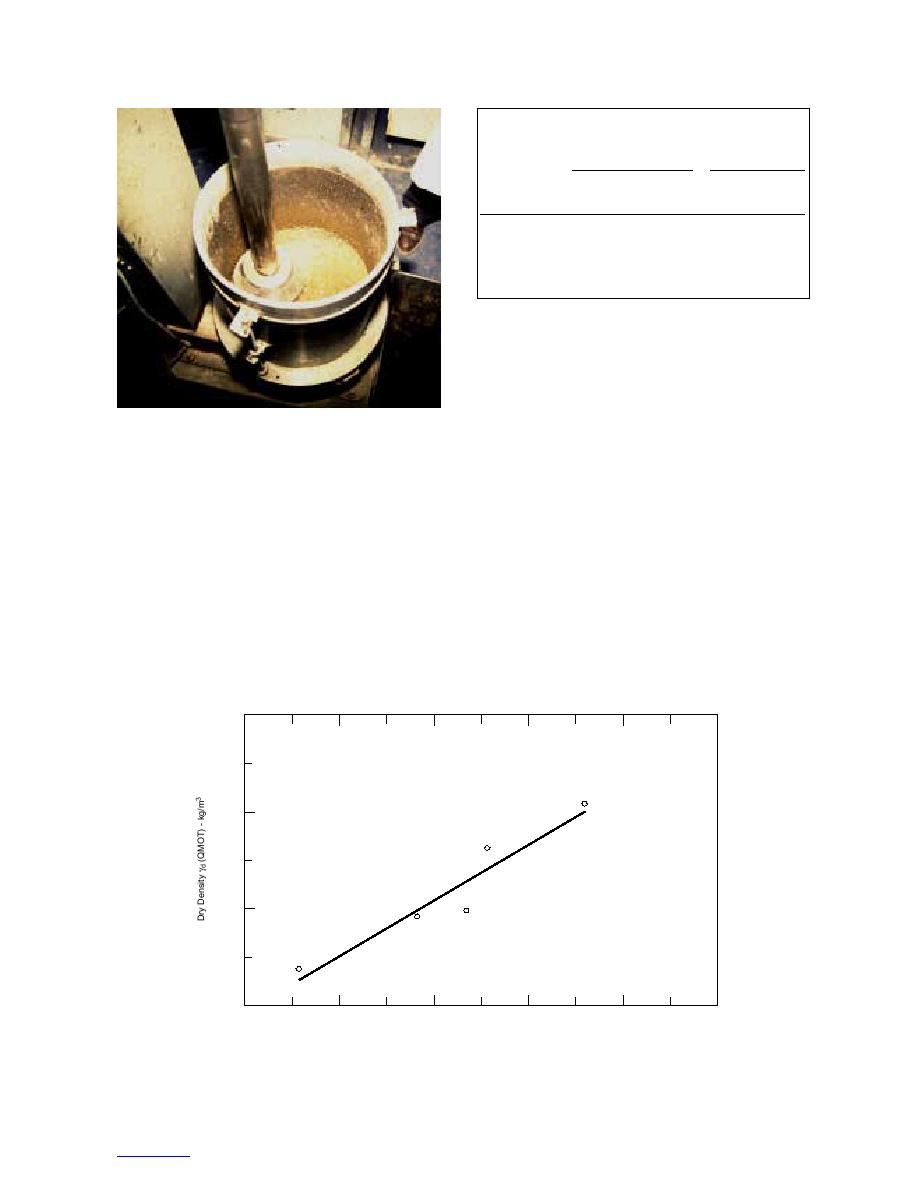
T-99 densities is shown in Figure 8. Based on the test
results, an estimate of the large-scaled density can be
made from the T-99 test results from the following equa-
tion:
γ d = 0.57γd T99 + 1163 (kg / m3 ) (see Fig. 8).
Figure 7. QMOT test equipment for moisture den-
(4)
sity test.
RESILIENT MODULUS AND
In both cases, the 100% crushed aggregates had a
SHEAR STRENGTH
lower density than the 100% natural material and, as
percent of natural aggregates in the mixture increased,
Resilient modulus and shear strength tests were con-
so did the dry density. A comparison of the optimum
ducted at the Corp of Engineers' Engineer Research
moisture and dry density from both tests is presented
and Development Center Geotechnical Structures Lab-
in Table 4. The moisture contents are significantly dif-
oratory (ERDC/GSL) in Vicksburg, Mississippi. The
ferent at the two ends of the spectrum (all natural and
blending of the natural to crushed ratios (100% natural/
all crushed). At the other percentages, they are very
0% crushed, 75% natural/25% crushed, 50% natural/
similar. The density on the average is about 12% higher
50% crushed, 25% natural/75% crushed, and 0% natu-
from the large-scale QMOT tests than from the AASHTO
ral/100% crushed) were done by VAOT personnel and
T-99 tests. The relationship between the large-scale and
shipped in 189-liter drums. Prior to sample fabrication,
2450
2400
2350
γd (large scale) = 0.57(T99) + 1163
R2 = 0.91
2300
2000
2050
2200
2100
2150
2250
Dry Density γd (T99) - kg/m3
Figure 8. Relationship between dry densities from T-99 and QMOT for test aggregates.
6


 Previous Page
