The Effect of Aggregate Angularity
on Base Course Performance
VINCENT C. JANOO AND JOHN J. BAYER II
where Mr
=
resilient modulus
INTRODUCTION
θ
=
bulk stress (at maximum deviator stress)
Base course performance in a pavement structure is
q
=
deviator stress
dependent on its properties. In current mechanistic
k1, k2, k3
=
material parameters (regression constants).
design procedures, this performance is tied to the elas-
However, gradation, plasticity index, density, tem-
tic properties of resilient modulus and Poisson's ratio.
perature, and moisture content also have an effect on
Resilient modulus is affected by stress state, moisture
the resilient modulus of base course materials. With
content, temperature, plasticity index, density, and gra-
respect to gradation, several factors affect the resilient
dation. Details on the effects of the various factors can
modulus: fine content, gradation curve shape, and max-
be found in state-of-the-art reports by Kolisoja (1997)
imum aggregate size (Thom 1988). For example, re-
and Lekarp (1999). The effect of stress state has been
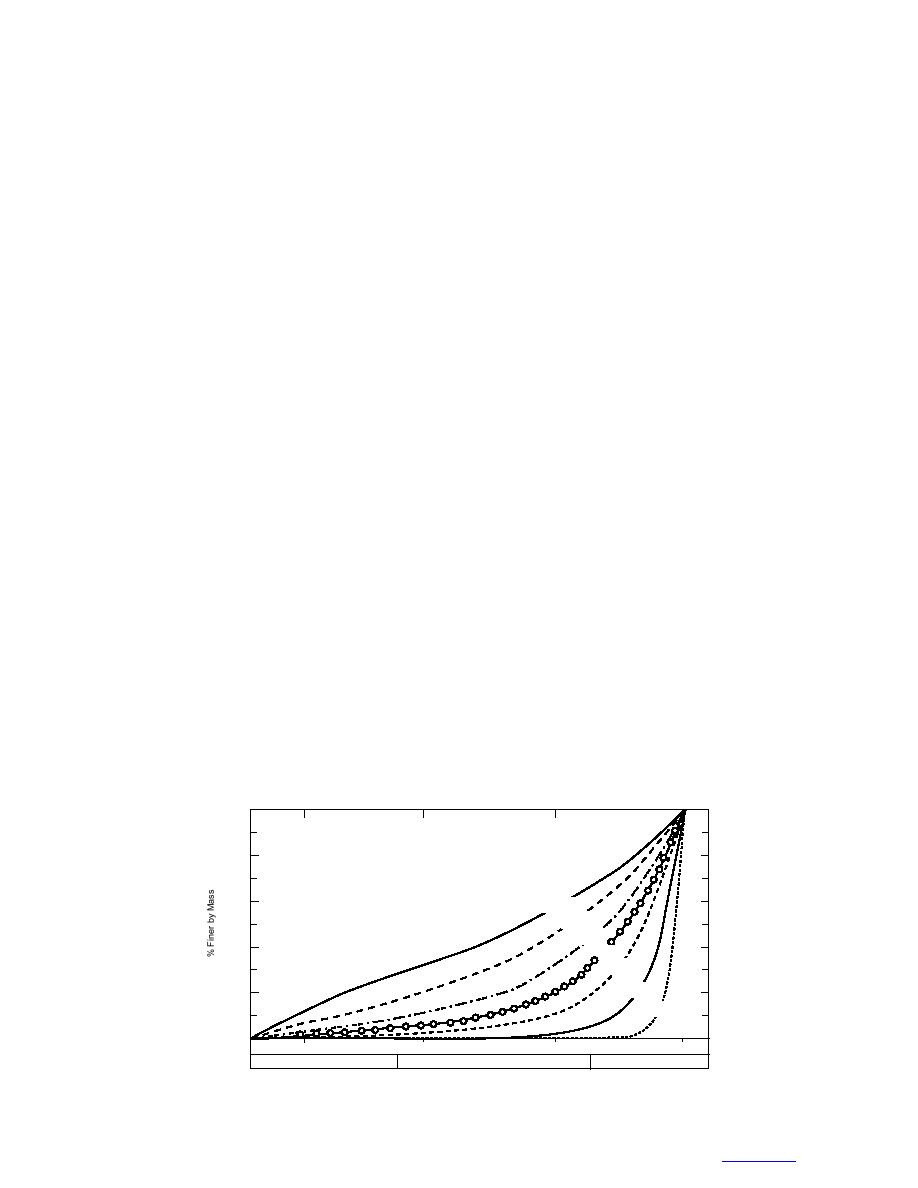
ferring to Figure 1, the stiffness of dry crushed lime-
researched in depth and the resilient modulus of granu-
stone increased by 1.5 to 1.8 when the sand content
lar materials has been related to bulk and deviator (or
(indexed by the value n) increased from n = 0.25 to n =
octahedral) stresses (Brown and Pell 1967, Hicks and
5.0. Sand content increases with decreasing values of
Monismith 1972, Uzan 1985). The following can be
n. Figure 1 can also be used to infer the effect of max-
used to estimate resilient modulus as a function of stress
imum size on resilient modulus. It can be surmised from
state:
Figure 1 that if resilient modulus increases with de-
M r = k1θk2
creasing values of n, then resilient modulus decreases
with increasing aggregate maximum size. Similar re-
Mr = k1θk2 q k3
(1)
sults were reported by Kolisoja (1997).
100
Characteristic Equation
% Finer = 100 (d/d100)n
80
Where: d
= sieve size
d100 = max particle size
60
n=0.25
n=0.35
n=0.5
40
n=0.7
n=1.0
n=2.0
20
n=5.0
0
0.1 mm
1 mm
10 mm
0.01mm
Silt
Sand
Gravel
Figure 1. Grain size distribution. (After Thom 1988.)


 Previous Page
