1800
1500
1200
900
600
300
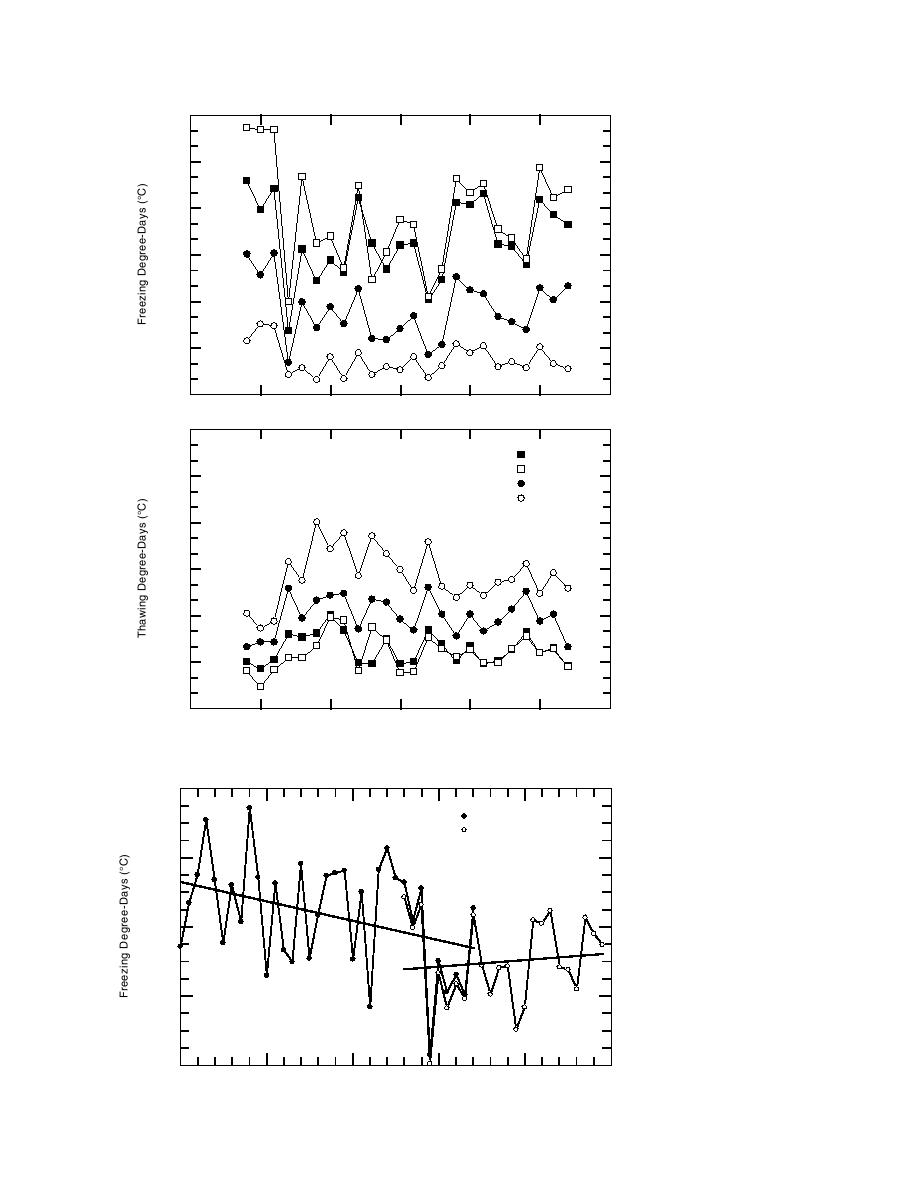
Figure 12. Seasonal varia-
tion of freezing and thaw-
0
ing degree-days for 1974
1997 for four locations on
1800
Cook Inlet.
Anchorage
Kenai
1500
Homer
Kodiak
1200
900
600
300
0
1970
1975
1980
1985
1990
1995
2000
2000
Figure 13. Season total
FDDs for Anchorage,
LaBelle et al. (1983)
This Study
Alaska. The 19481982
data, reported by LaBelle
1600
et al. (1983), are compared
with those for 19741997
y = 3.84x 6631
obtained for this study
from Air Force Combat
1200
Climatology
Center
(AFCCC). Opposite trends
in mean temperature are
evident.
y = 11.22x + 23313
800
400
1958
1968
1978
1988
1998
1948
21


 Previous Page
