Table 4. Dates of first significant ice for Upper (defined as 10% ice con-
centration at the Phillips Platform) and Lower Cook Inlet (undefined),
and corresponding freezing degree-days (FDDs) at Anchorage and Kenai,
respectively. Using the base value of 3.9C to calculate FDDs yielded
the best correlation for ice formation in the Upper Inlet. Extreme values
are in bold. (After Poole and Hufford 1982.)
Ice
Upper Inlet
FDDs
Lower Inlet
FDDs
(Base 3.9C)
(Base 3.9C)
first ice
season
first ice
1969-70
Nov 18
179
Dec 19
140
1970-71
Nov 21
161
Dec 15
167
1971-72
Nov 23
182
Dec 2
127
1972-73
Nov 13
176
Dec 14
185
1973-74
Nov 18
206
Dec 9
307
1974-75
Nov 24
166
216
Dec 29
1975-76
Dec 11
Nov 12
233
409
1976-77
131
--
--
Dec 10
1977-78
Nov 20
185
310
Dec 2
1978-79
Dec 16
Dec 22
188
120
1979-80
Dec 12
141
Dec 18
160
Mean s.d.
Nov 25 12 days 171 33
Dec 14 9 days
221 91
(Nov 13Dec 7)
(Dec 5Dec 23)
Earliest
Nov 12
Dec 2
Latest
Dec 10
Dec 29
30 Dec
15 Dec
30 Nov
15 Nov
Lower Inlet
Upper Inlet
1 Nov
150
200
250
300
350
400
100
450
Freezing Degree-Days (C)
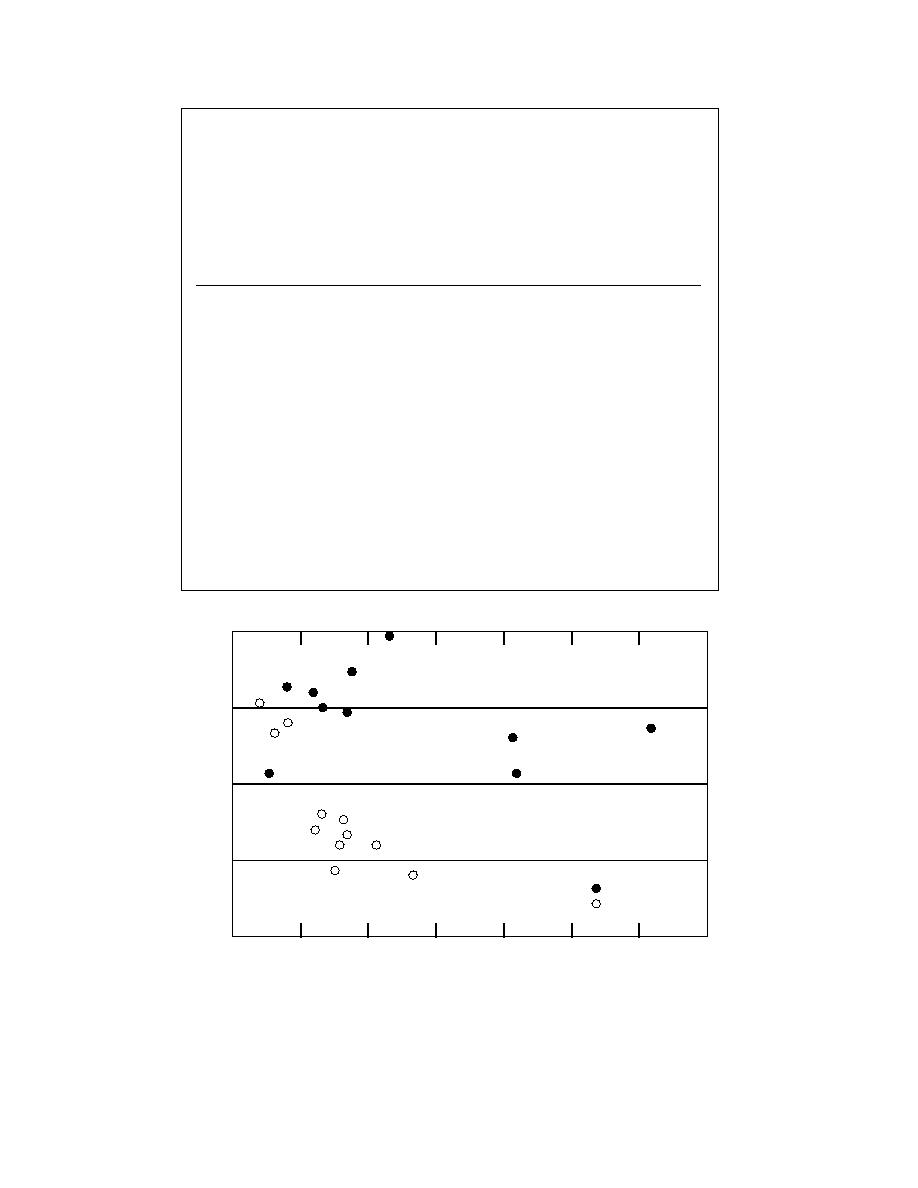
Figure 10. Dates of significant ice formation at the Phillips Platform with
respect to freezing degree-days (assuming a base temperature of 3.9C).
Anchorage FDDs were used for the Upper Inlet, and Kenai data were used
for the Lower Inlet. (After Poole and Hufford 1982.)
16


 Previous Page
