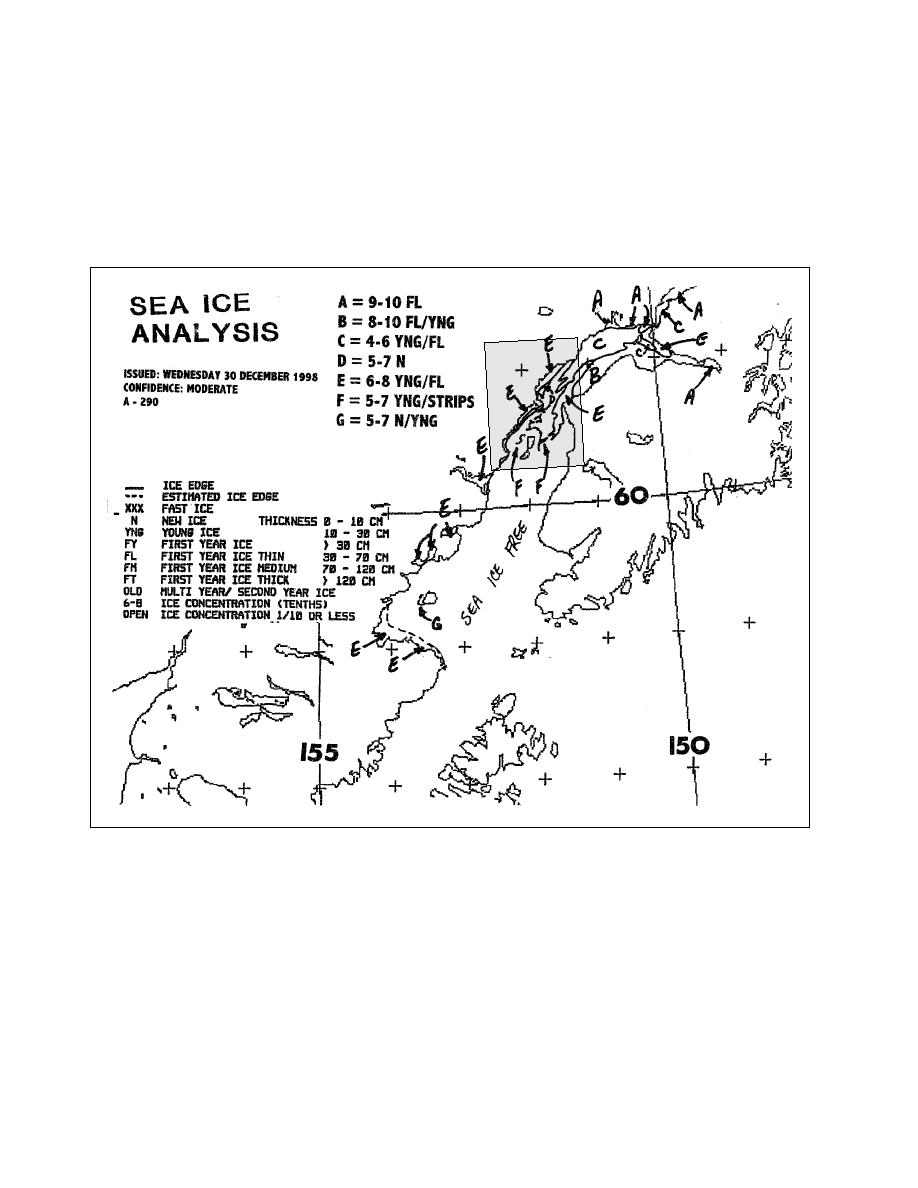
Figure 15. Example of a sea ice analysis chart issued by the Alaska Region Headquarters of the Na-
tional Weather Service. Regions of similar ice type are assigned the same code letter by the NWS
forecaster, and a key is placed in an open area on the chart. The code letters may change from chart to
chart, as their purpose is simply to provide an abbreviated way to define the regions and avoid clutter
on the report. This particular analysis was produced using, among other tools, the SAR image shown
in Figure 14. The shaded rectangle shows the image footprint over the Inlet.
24


 Previous Page
