6
3000
6
6
2000
6
3
6
6
5
6
6
6
7
6
7
6 6
6
6
6
1000
6 12
8
3
3
5
3
6
3
6
3
0
Constr. Materials
Corps Paints and Commercial Coatings
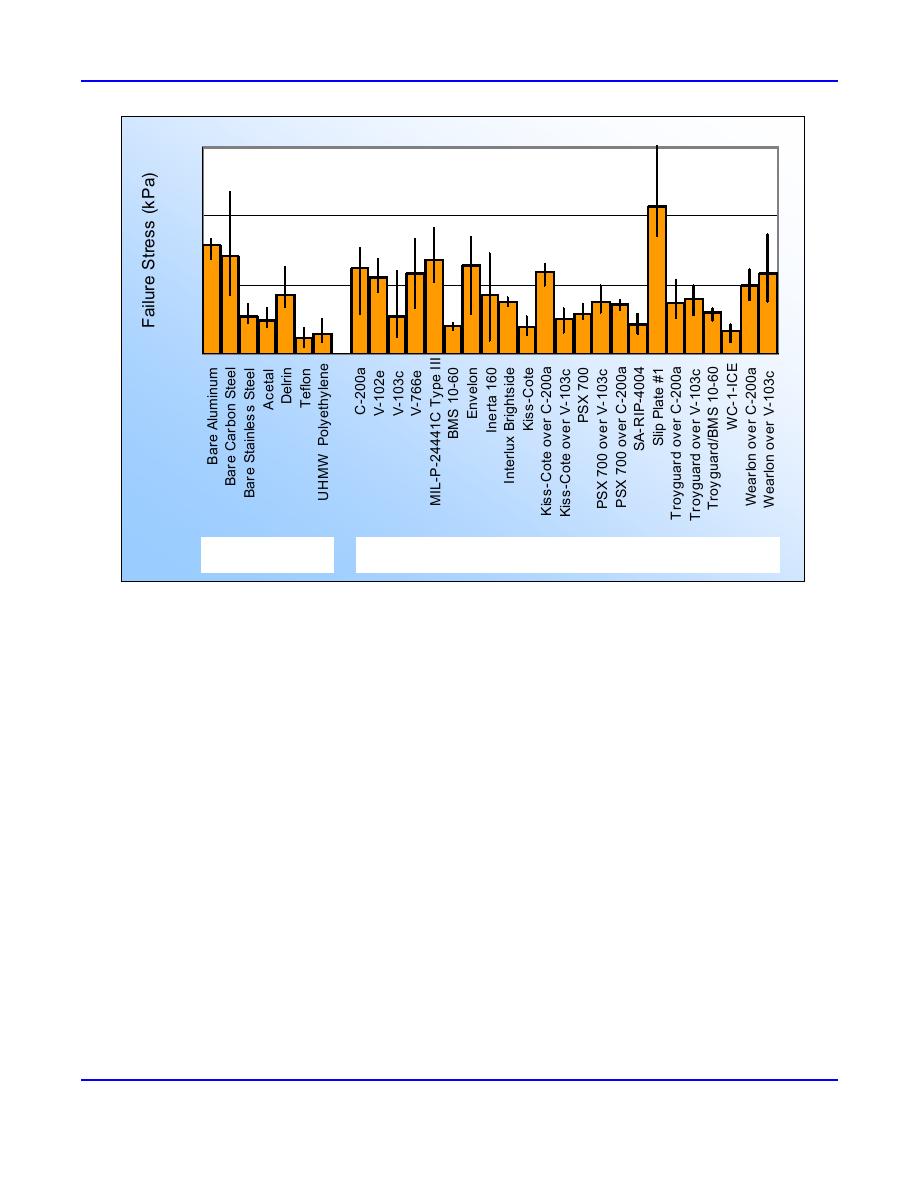
Figure 5. Results of laboratory ice adhesion shear testing of some construction materials, USACE paints, and commercial
icephobic coatings. Error bars indicate the range in test values, numbers represent the number of that sample type tested,
and the height of each column is the measured mean value.
Results
Figure 5 shows the results of our laboratory adhesion tests for the various coatings and materials in their new condition.
The height of each bar indicates the average failure stress measured for each material; the error bars indicate the range in
values measured for the entire coating or material group. The number at the top of each error bar shows the sample size.
Teflon and polyethylene had the lowest average adhesion strengths, as do the commercial coatings WC-1-ICE and Kiss-
Cote, which were each applied to aluminum piles. On carbon steel piles, we found that the V-103c vinyl paint performed as
well as PSX-700. In fact, all the icephobics except Kiss-Cote increased the mean adhesion strength for V-103c, though not
significantly. Although the V-103c vinyl paint by itself appears to significantly lower ice adhesion, this is not generally true
for the other paints typically used by the Corps. The V-766e and V-102e had average adhesion strengths that were only
2025% less than bare carbon steel, and epoxies C-200a and MIL-P-24441C Type III have adhesion strengths about the same
as bare carbon steel. Furthermore, using the Wilcoxon Ranked Sum test, we found that there was no statistical difference, at
the 95% confidence interval, between the performance of the V-103c and any of the coatings applied to it. However, there
was a statistical difference between C-200a alone and C-200a with TroyGuard applied over it. Furthermore, we found that all
the icephobic coatings except Kiss-Cote reduced the mean adhesion strength for the C-200a coal tar epoxy, with both PSX-
700 and TroyGuard reducing the adhesion strength by about 40 percent.
Table 2 and Figure 6 show the results of laboratory adhesion test comparisons before and after field exposure of the
sample piles. The table lists their standard deviations, whereas the figure shows the data ranges with the use of error bars.
These results show that, in most cases, there was no statistically significant difference in the before-and-after adhesion
strengths (the orange data, Figure 6). These materials all seemed to hold up well in this six-month field trial, both in qualita-
tive appearance of their general condition, and as measured by relatively little difference in ice adhesion.
ERDC/CRREL TN-03-4
5


 Previous Page
