8
ERDC/CRREL TN-03-3
70
FT
60
50
40
30
20
10
C
0
0
2
4
6
8
10
12
14
16
18
20
70
FT
60
50
40
30
20
10
C
0
0
2
4
6
8
10
12
14
16
18
20
Test #
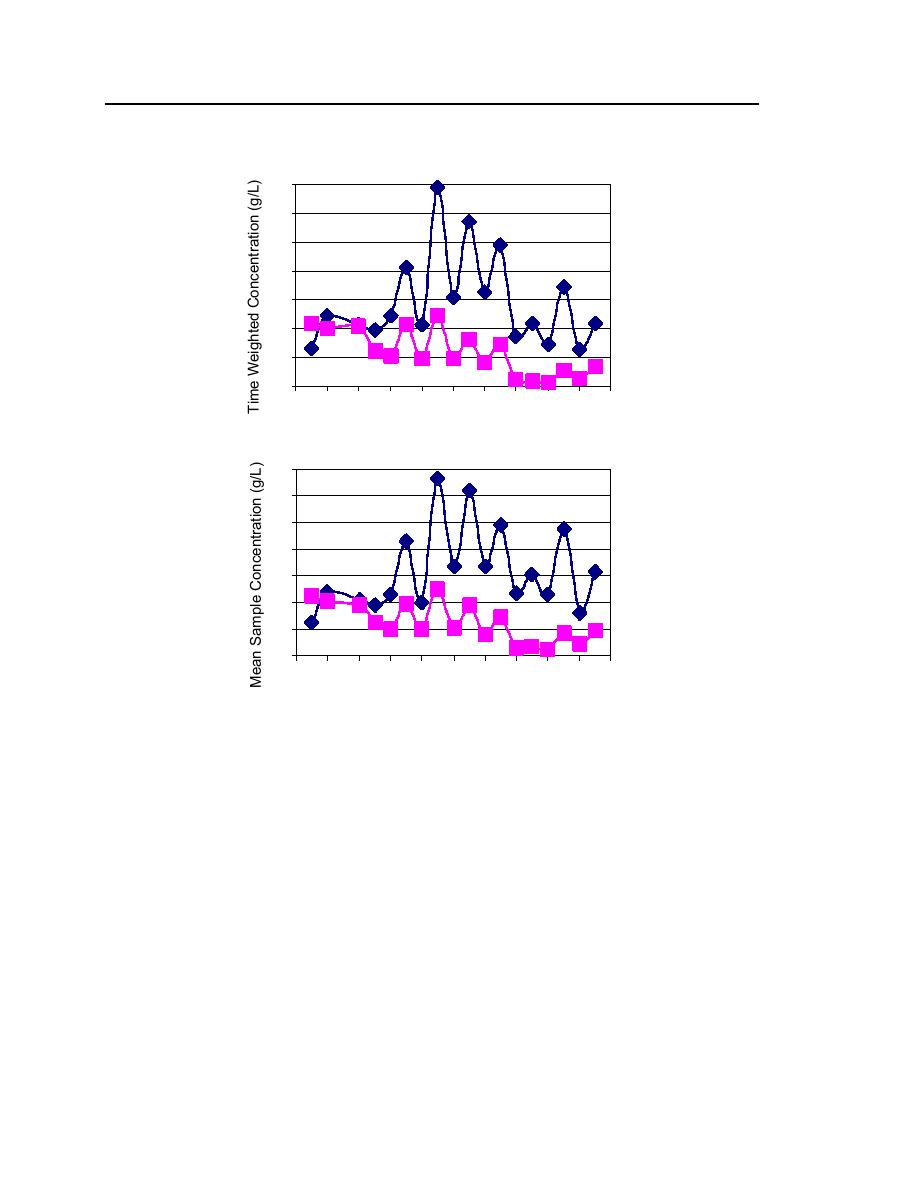
Figure 6. Time-weighted and mean sediment concentrations in samples
from each bin.
Mean and time-weighted sediment concentrations are presented in Figure 6
for FT and C bins in each test. The concentration values are slightly different, but
the overall patterns are the same. From test 6 on there is a strong and consistent
dependence in both FT and C concentration parameters on the imposed slope.
Concentrations obtained in tests 15 are not related to slope. Differences in
moisture content among this 1518% group appear to dominate the effects of
slope, suggesting to us a need for retesting. Test 15 concentrations are low for the
C bin relative to other tests in the high moisture series (3638%) and the FT
contrast is significantly greater. Grouping the intermediate (2628%) and high
moisture series, the eroded concentrations generally diminish with both increased
moisture content and flow.


 Previous Page
