Overland erosion due to freezethaw cycling
13
high flow tests of this series produce the smallest ratios of the group. Table 1
gives the average norms for each section and test series, and the ratio of these
norms. At 0.3 L the ratios of the norms are approximately equal for each test
series, and increase dramatically with soil moisture. The same rough equality of
norm ratios exists at 0.7 L, but the ratios at low soil moisture are much larger and
the increase with soil moisture is less extreme. Together, these results indicate
that erosion of the FT bin relative to that of the C bin increased with soil moisture
and approached an order of magnitude difference at saturated soil conditions.
30
L2(30)
25
Linf(70)
20
L2(70)
15
Linf(30)
10
5
0
0
2
4
6
8
10
12
14
16
18
20
Test #
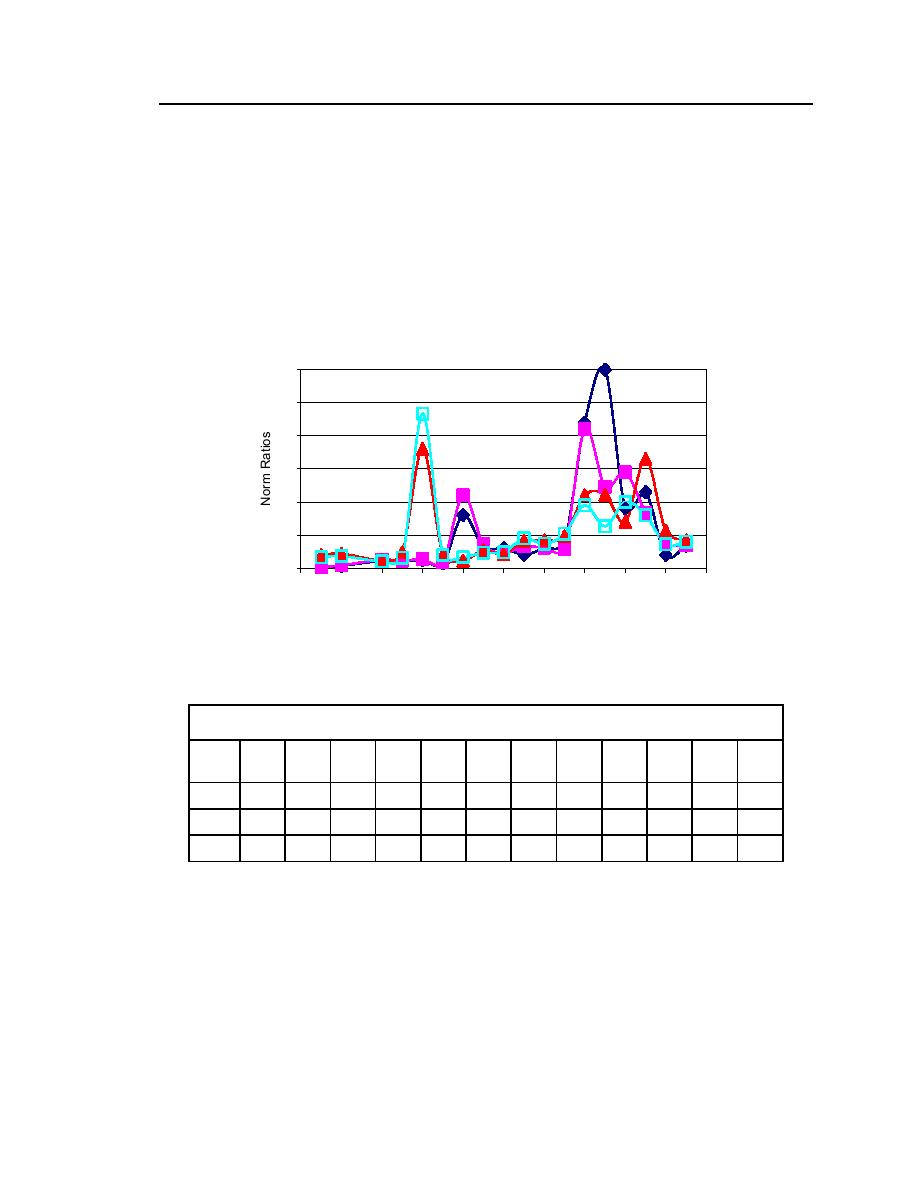
Figure 10. Linf and L2 ratios.
Table 1. Average norms (cm) and their ratios by test series.
Test
F30
C30
R30
F30
C30
R30
F70
C70
R70
F70
C70
R70
series
L2
L2
L2
Linf
Linf
Linf
L2
L2
L2
Linf
Linf
Linf
17
1.8
2.2
0.82
3.1
3.3
0.94
3.4
1.4
2.5
5.1
2.5
2.0
813
2.5
0.8
3.0
4.1
1.3
3.3
2.8
0.8
3.3
4.4
1.3
3.5
1419
1.5
0.2
6.6
3.1
0.4
7.2
1.7
0.2
7.7
2.8
0.5
5.8


 Previous Page
