12
ERDC/CRREL TN-03-3
10
F70
8
6
F30
4
C30
2
C70
0
0
2
4
6
8
10
12
14
16
18
20
7
6
F70
5
4
3
2
F30
C30
1
C70
0
0
2
4
6
8
10
12
14
16
18
20
Test #
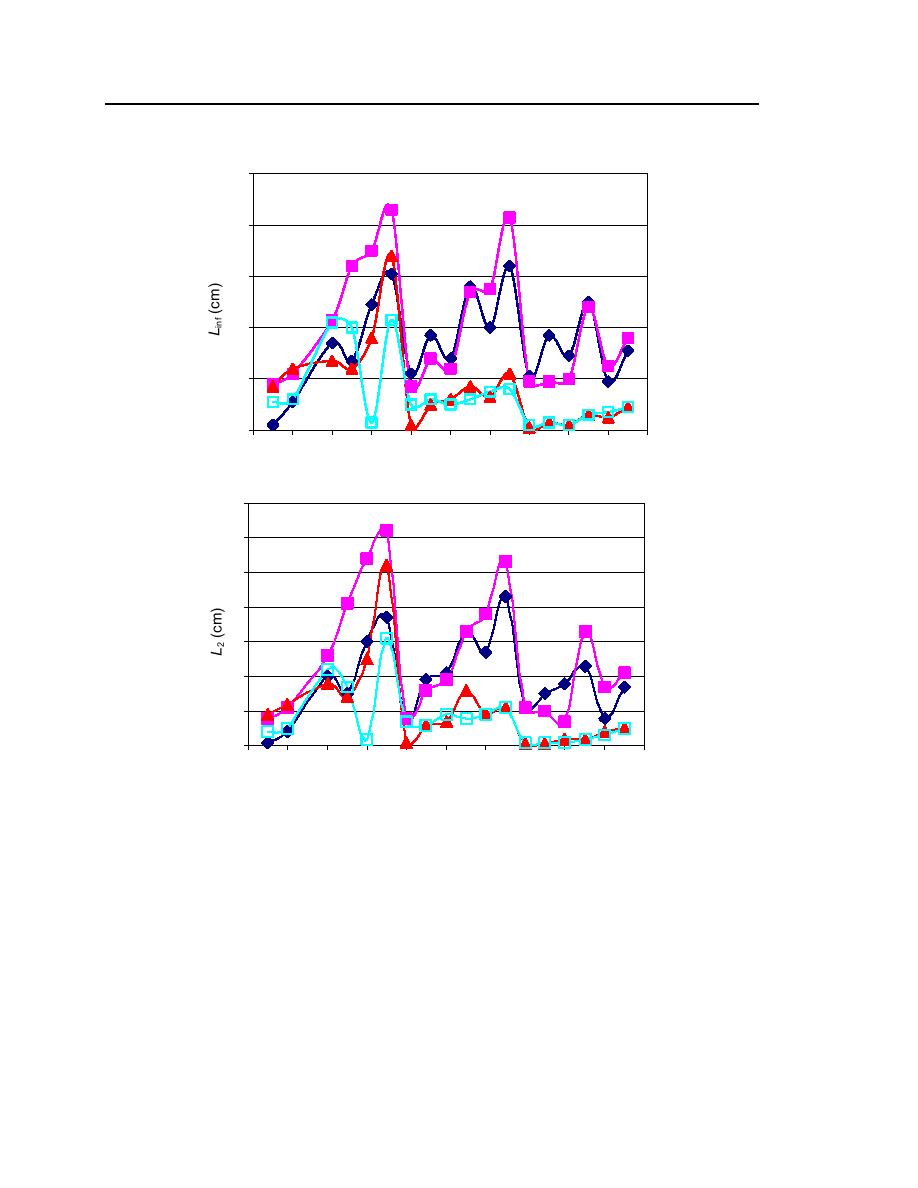
Figure 9. Linf and L2 values from cross-sectional data.
FT/C ratios of the two measures were obtained for both cross sections of
each test; results are presented in Figure 10. Like the ratios derived from the
concentration data, the ratios are generally small and increasing through the low
and intermediate soil moisture series. The sections at 0.7 L in test 6 and at 0.3 L
in test 8 have anomalously high ratios, indicating excessive erosion in a part of
the FT bin at low and moderate soil moisture.
In the high soil moisture series the ratios are generally high, a result of very
minor erosive change in the C bins. Greater relative erosion of the C bins in the


 Previous Page
