6
ERDC/CRREL TN-03-3
The experiments were conducted in three series of gradually increasing soil
moisture content. Within each series three different flow rates were applied at
two different slopes. We tested three soil-moisture ranges: 1518%, 2628%, and
3638% (saturated soil) by volume; three flow rates, 0.2, 0.6, and 1.2 gpm; and
two slopes: 8 and 15. We collected discharge samples from each soil bin at
planned intervals during each experiment to calculate the sediment losses. The
total sediment mass contained in these runoff samples provides an integrated
measure of erosion along the entire length of each bin. After each experiment,
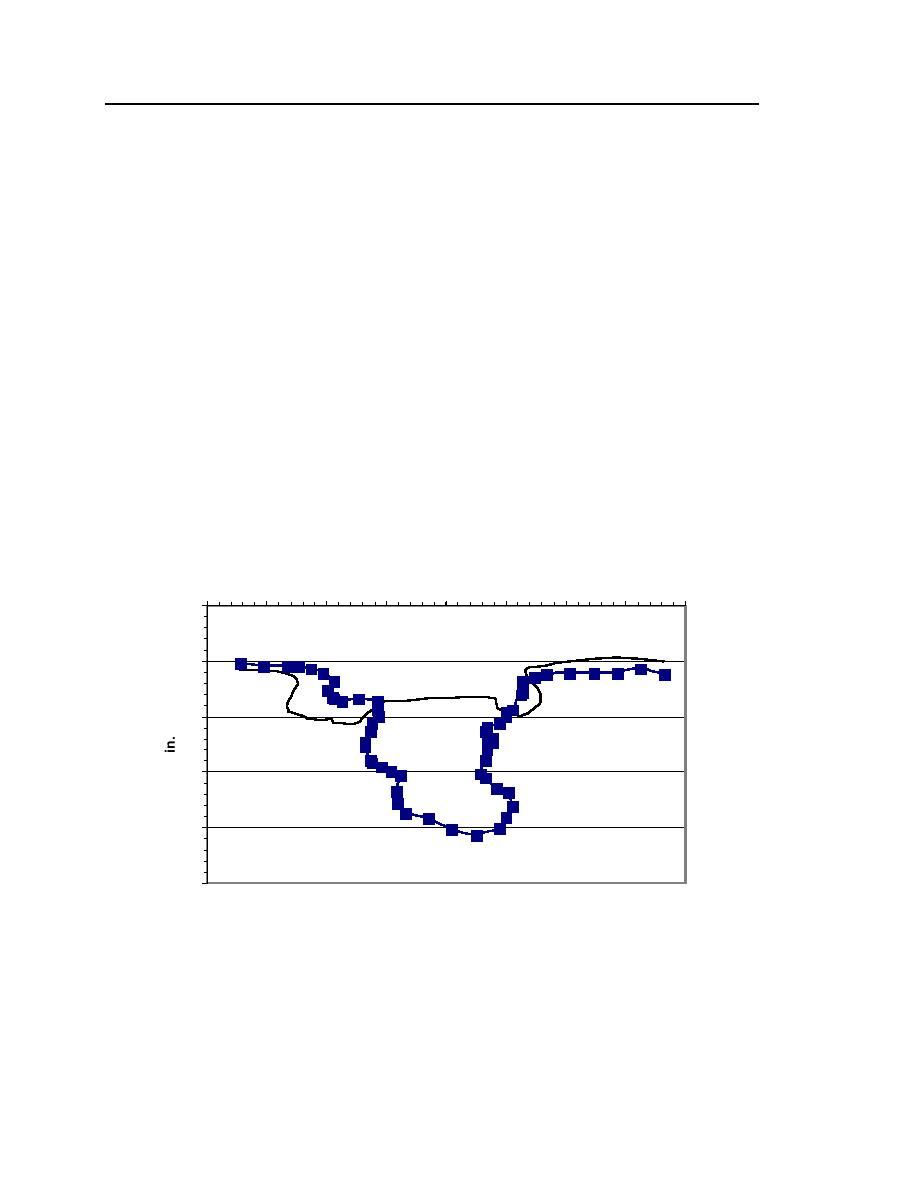
we measured the cross-sectional geometry of the rill that had formed in each bin
(Fig. 4). We measured the rill shape at two locations, about 10 inches upstream
of the weir (designated 0.3 L) and about 21 inches upstream of the weir (0.7 L)
(where L is bin length). These measurements gave us site-specific erosion data.
We also measured groundwater levels before, during, and after each experiment;
water surface elevation and slope in the rill near the end of each experiment; and
area of the eroded rill. This technical note discusses the results of our initial
analyses of the sediment loss and cross-section measurements; more complete
results and analyses will be published in journal papers being prepared.
in.
3
4
5
6
7
8
9
10
11
4
5
6
7
8
9
Figure 4. Rill cross sections measured at 0.3 L after experiment 13 (line
with squares is the FT rill).


 Previous Page
