October
November
December
January
February
March
10
20
10
20
10
20
10
20
10 20
10
3
24 x 10
Open Water
600
5%
20
10%
20%
500
40%
16
50%
400
12
300
8
200
4
100
0
0
0
20
40
60
80
100
120
140
160
Time (days)
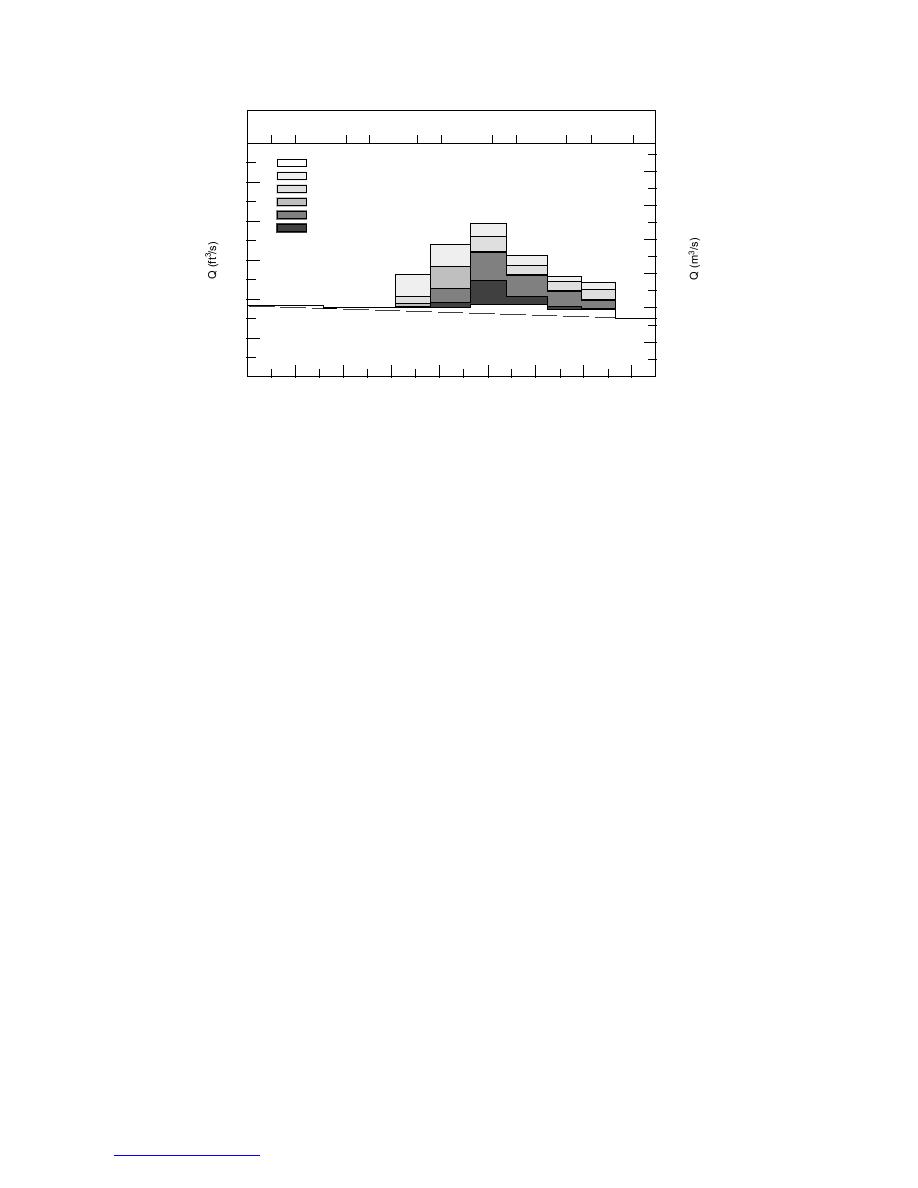
Figure 10. Minimum releases from Gavins Point Dam on the Missouri River for a
range of exceedance probability ice events. (After Wuebben et al. 1992.)
Missouri River below the Gavins Point Dam
sheet or a juxtaposed ice cover on a given reach,
experiences this problem.
a peaking flow hydrograph might result in a
The severe drought conditions of the late 1980s
shorter, thicker cover at a more downstream
led the U.S. Army Corps of Engineers to investi-
location. The spatial extent and type of ice cover
gate the effects of ice formation on flow regula-
on a reach directly affects the stage and available
tion on the lower Missouri River downstream of
channel area for fish habitat, particularly in wide,
Gavins Point Dam. The study by Wuebben et al.
shallow rivers. A fluctuating flow pattern may
(1992, 1995) used a probabilistic approach to de-
result in premature or repeated ice breakups over
velop a method for adjusting planned release
the course of the winter, and this may have a nega-
schedules from Gavins Point Dam to compensate
tive effect on the overwintering habitat for fish.
for the flow deficits caused by ice jams. A statisti-
The Green River in Utah is an example.
cal analysis of weather records and a review of
The Green River near Vernal, Utah, is habitat
historical ice and low-flow events allowed empiri-
for several endangered fish species, including the
cal estimates of future ice conditions to be made,
Colorado squawfish, the razorback sucker, the
based on predicted weather and planned releases.
humpback chub, and the bonytail. About 160 km
The study included both long- and short-term
upstream of Vernal, near the Wyoming border, a
planning approaches that allow operators to
hydroelectric project at the Flaming Gorge Dam
select an ice-affected release schedule, based on
follows a daily peaking schedule that fluctuates
between 23 and 110 m3/s, depending on demand.
an acceptable level of risk. Figure 10 is an example
of a long-term planning tool produced by the
Recent studies have suggested that ice movement
study. For an ice event with a given exceedance
and shoreline scouring from ice breakup can be
probability, a water-control planner can select a
undesirable for the overwintering habitat of juve-
release schedule to avoid downstream discharge
nile endangered fish species (USFWS 1992). Daly
deficits.
et al. (1997) examined the effect of daily fluctua-
tions from the Flaming Gorge Dam on ice cover
Midwinter flow regulation
formation and stability in the study reach hosting
and fish habitat
the endangered fish species. The study included
Winter reservoir operation influences the natu-
research on historical ice and hydrometeorologi-
ral ice regime on rivers, and may affect fish sur-
cal data, a field observation program during the
vival. In particular, hydroelectric peaking cycles
winter of 199697, and a computer simulation of
can affect ice processes for great distances down-
ice cover formation, calibrated to field-measured
stream. Where a steady flow might produce a
data. Field observations and ice measurements
14
Return to contents pg


 Previous Page
