

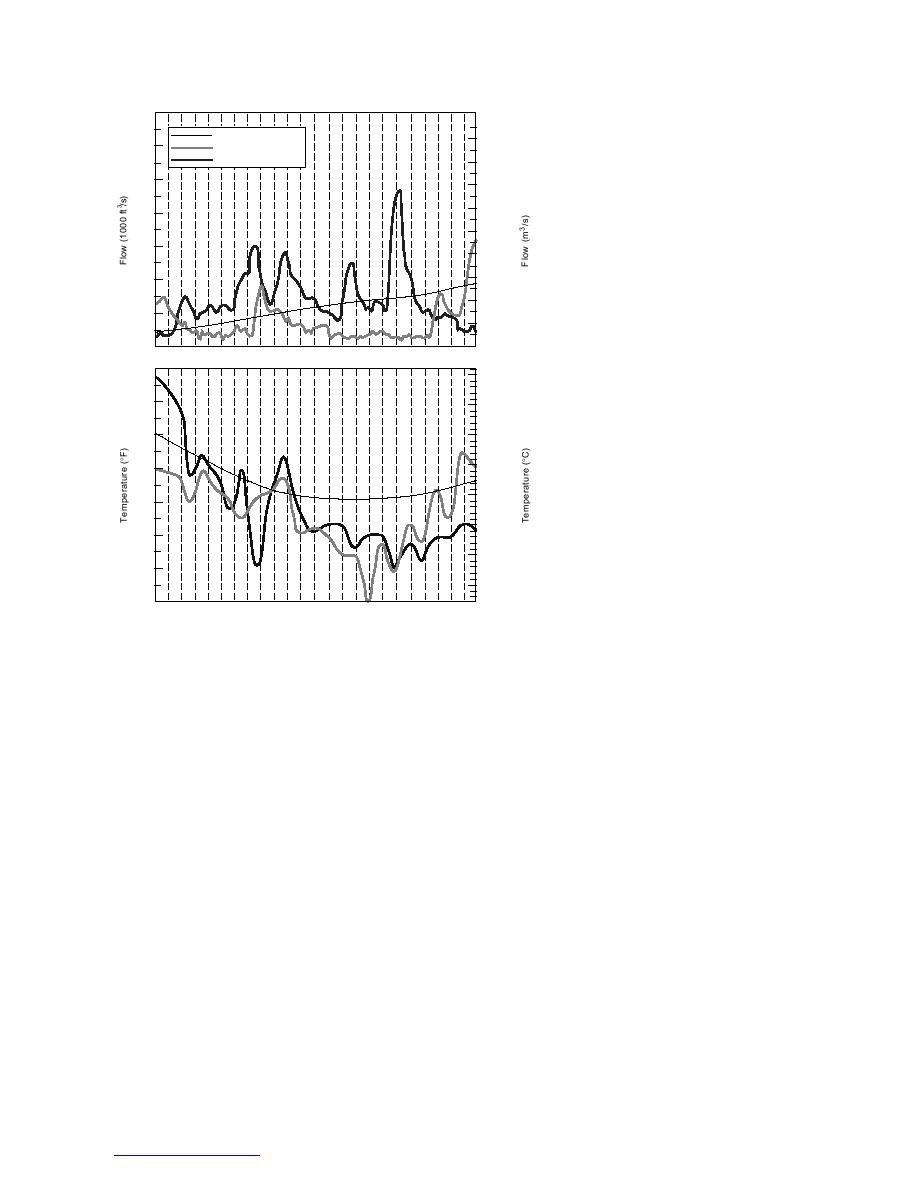
Ohio River: Markland Dam, 1978
700
As mentioned earlier, December
Long Term Average
18,000
600
1976 1977
and January of 1978 saw high dis-
1977 1978
16,000
charge, extreme cold, and record ice
500
formation on the Ohio River and its
14,000
tributaries. Figure 13 shows tempera-
12,000
400
ture and discharge data for the win-
10,000
ters of 197677 and 197778. The
300
8,000
regime of the river had been sub-
stantially altered in the previous half
6,000
200
century by the gradual replacement of
4,000
low-head wicket dams with higher,
100
2,000
more widely spaced modern lock and
0
0
dam projects. These structures pass
ice either through overflow gates
70
20
placed in the upstream bulkhead of
the auxiliary locks or through tainter
60
15
gates on the dam, sometimes lifted
10
50
completely out of the water. Figure 13
shows the four-fold increase in dis-
5
40
charge resulting from rainfall and
snowmelt runoff during 2528 Janu-
0
30
ary 1978. Although flow and ice was
5
retained at storage reservoirs on
20
tributaries, nearly all downstream ice
10
ran throughout the Ohio River sys-
10
tem. Late on 25 January, the rainstorm
15
t r a n s f o r m e d into what became
0
5 10 15 20 25
5 10 15 20 25
5 10 15 20 25
5 10 15 20 25
known as the "Blizzard of '78," hin-
November
December
January
February
dering visibility and communication
Figure 13. Ohio River discharge and air temperature at Cincinnati,
and further worsening operating con-
winters of 197677 and 197778, compared to long-term averages.
ditions for the river projects and navi-
(After USACE 1978.)
gation. On 26 January, a substantial
ice jam 26 km upstream of Markland
Although uncommon, severe ice events have
Dam released, sweeping 19 loose barges and a
substantially damaged river structures. Because
towboat against the gates of the dam (Fig. 14).
events of this magnitude are so infrequent, there
Following the passage of the flood wave, the ice
may not be any operational experience upon
pileup remained, blocking the lock approach and
which to fall back. Similar to an extreme open
making it difficult to extricate the trapped and
water flood event, the usual response at a run-of-
sunken vessels (USACE 1978).
the-river dam is to maintain a maximum gate
opening to allow passage of water and ice with-
Illinois River: Dresden Island Dam, 1982
out damaging the structure. It is also critical to
Upstream of Dresden Island Dam, the Des
coordinate operations with other projects and
Plaines and Kankakee Rivers join to form the Illi-
emergency response organizations.
nois River. The Kankakee, a heavy frazil ice pro-
The following is a compilation of extreme ice
ducer, has experienced many severe ice jams and
events at dams and the actions taken. Well known
ice jam floods on its lower reaches. In 1982 an ice
floe, about 0.16 km2 in area, released from the lower
examples of structural damage caused by breakup
ice are Markland Dam on the Ohio River in 1978,
Kankakee and drifted into the Dresden Island
Dresden Island Dam on the Illinois River in 1982,
Dam, causing .2 million of damage to two tainter
and Safe Harbor Dam on the Susquehanna in
gates. Although the usual action for avoiding severe
1996. Less well known near-disasters occurred at
ice impact is to pull the gates completely out of
dams on the Clark Fork River at Missoula and
water, this was not possible because the two gates
Thompson, Montana, in 1995.
were under repair and not functional at the time.
18
Return to contents pg

 Previous Page
