10 6
4
10
25,000 ft3/s
Qmax = 25 Kcfs
5
(710 m3/s)
m /s)
10
10 3
10 4
Future (2036)
10 2
35,000 ft3/s
Qmax = 35 Kcfs
10 3
(990 m3/s)
/s)
10 1
10 2
001
..01
0.1
1
5
10 20 30
50
70 80
90 95
99
99.9 99.99
Percent Non-Exceedance
e
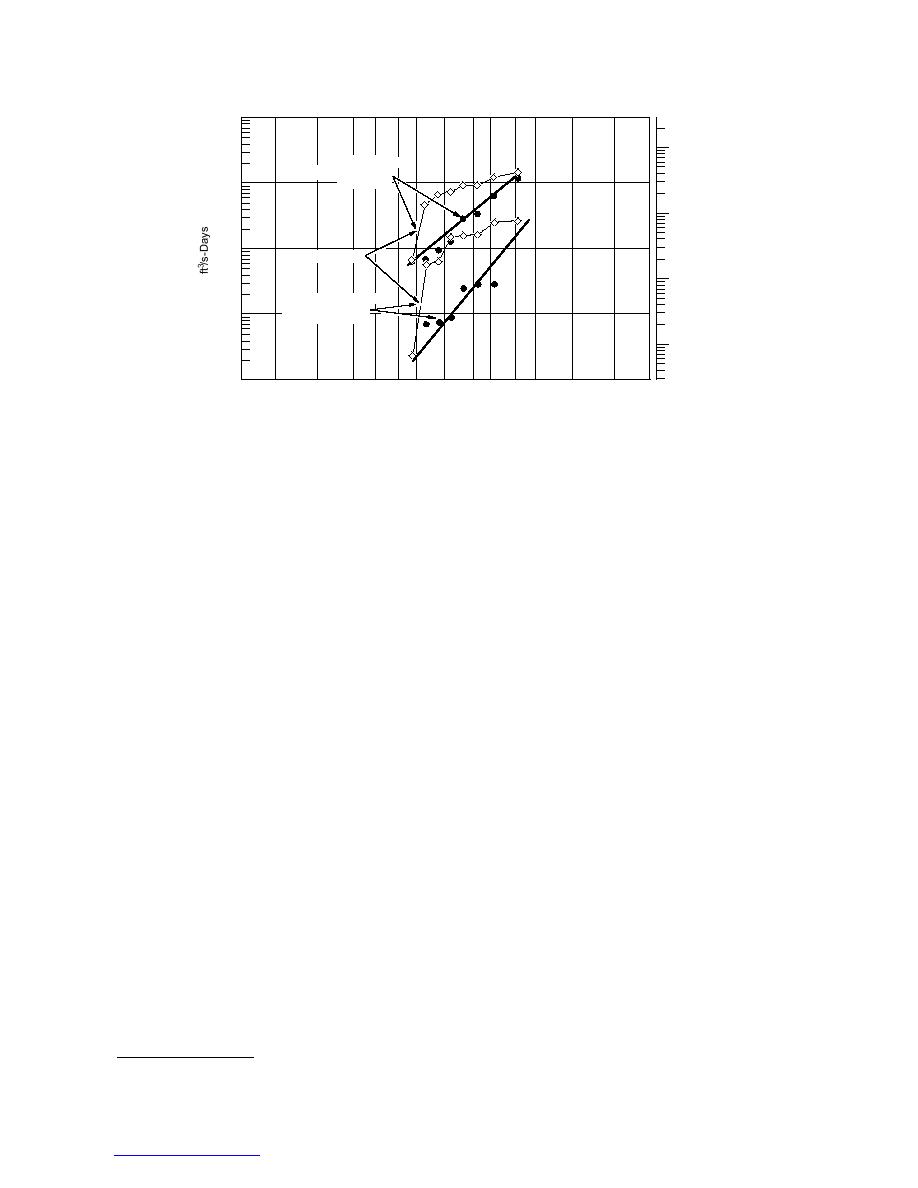
future and existing conditions at Oahe Dam, Pierre, South Dakota. (After Daly et al.
1997.)
gram of field tests, Breland (1995) concluded that
Upper Niagara River:
it would be possible to increase the winter outflow
Niagara Falls, New York
to 83% of the plant capacity without adversely
On the Upper Niagara River, early to midwin-
affecting downstream ice conditions, or increas-
ter ice jams have historically caused flooding and
ing the flood risk to low-lying areas in White-
interfered with hydroelectric production. The
horse. The ICESIM* model was used to first simu-
New York Power Authority's (NYPA) Niagara
late ice cover formation over a range of discharges,
Power Project in the U.S. and the Ontario Hydro
then to calculate water surface profiles resulting
(OH) stations in Canada have a combined gener-
from different peak flow levels. Field observations
ating capacity of about 4700 MW and can poten-
tially divert as much as 4730 m3/s of the total
during the winter of 1994 found the model to be
average river flow of 5660 m3/s. However, the
a reasonable, though somewhat conservative, pre-
dictor of stage because the actual river ice proved
1950 Niagara Treaty between the U.S. and Canada
to be smoother and thinner than the ice cover pre-
limits the total diversion flow at any particular
dicted by ICESIM.
time.
Based on field test results, Breland found that
Ice jams on the Upper Niagara River result
large increases in flow are possible once the ice
from storm surge events that break up the ice
cover has been given time to smooth. The magni-
cover on the eastern portion of Lake Erie and
tude of this increase depends on the observed ice
drive ice over the Lake ErieNiagara River ice
conditions of any given year and it should not
boom. The surges can raise the lake level at Buf-
exceed the ice cover's ability to flex vertically
falo by up to 2 m and nearly double the water
without breaking up. The flow increase should
discharge in the Upper Niagara River. It takes
not force significant water flow on top of the ice.
about 12 hours for the ice to travel the 56 km from
Breland recommended that the water levels
Lake Erie to the power plant intakes, located on
resulting from the increase in discharge should
the banks of a relatively shallow reach of the river
not exceed the peak water levels observed during
above Niagara Falls known as the Grass Island
the ice-formation period. Finally, the flow increase
Pool (Crissman et al. 1994). Figure 6 shows an ice
should not be great enough to fracture, shove, or
jam in front of the NYPA intakes in February of
cause breakup of the ice cover.
1964.
Studies by NYPA (1998) examined the ice and
flow processes that lead to ice stoppages and jams
on the Upper Niagara River. The approach com-
* Acres American, Ltd., developed the ICESIM model.
10
Return to contents pg


 Previous Page
