m
in.
50
1.2
Barenberg et al. (1975)
} This Study
40
1.0
Wheel Load = 89.0 kN (20,000 lb)
0.8
30
Tire Pressure = 520 kPa (75 psi)
Without Geotextile
0.6
20
Wheel Load = 22.2 kN (5,000 lb)
0.4
Tire Pressure = 345 kPa (50 psi)
With Geotextile
10
0.2
0
0
0
10
20
30
40
50 kPa
Undrained Shear
Strength 0
1
2
3
4
5
6
7
psi
CBR
0
0.25
0.50
0.75
1.00
1.25
1.50
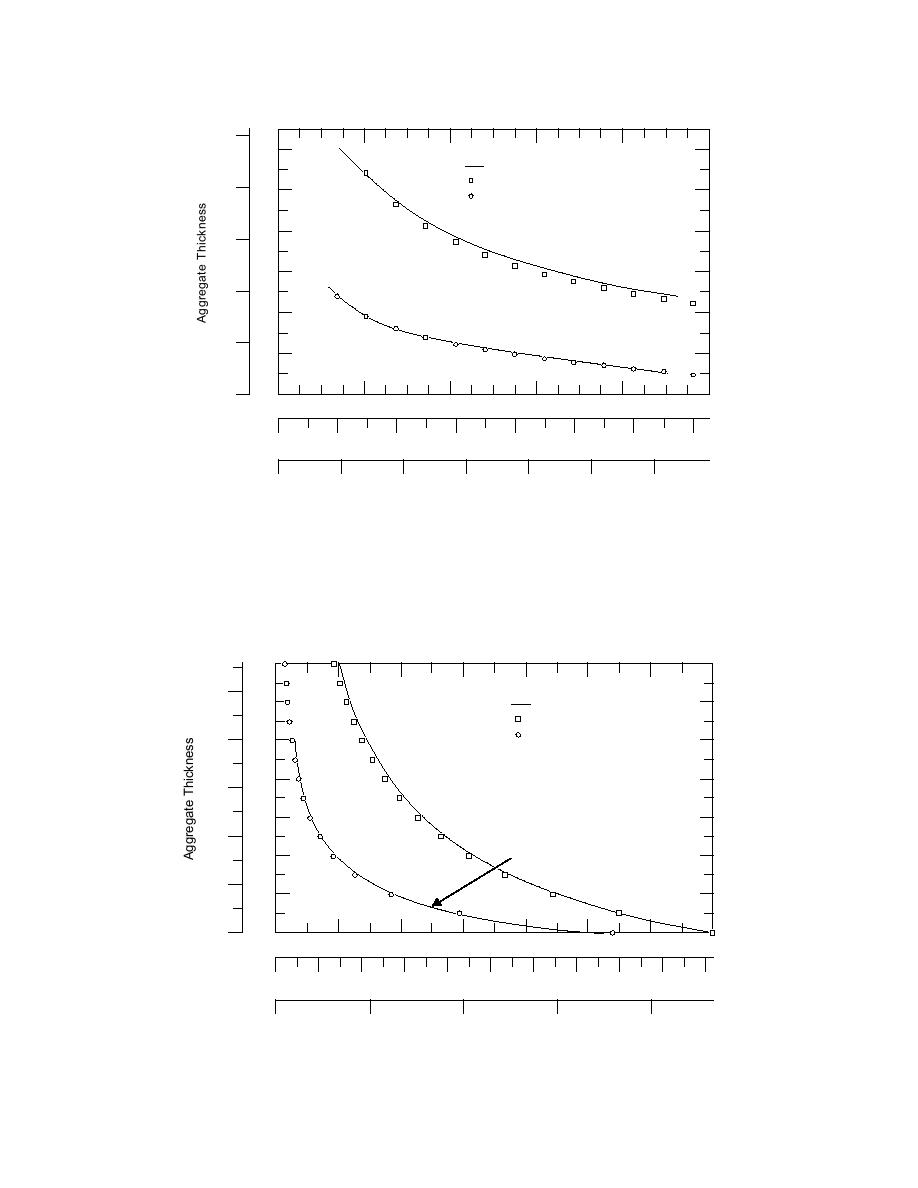
Figure 11. Static loading design curves from Barenberg et al. (1975) and design points generated
for this report according to method documented in Appendix B.
in.
m
1.4
50
1.2
Barenberg et al. (1975)
} This Study
40
1.0
Axle Load = 870 kN (196,000 lb)
0.8
30
Tire Pressure = 620 kPa (90 psi)
Off-Highway Vehicle
0.6
Axle Load = 80 kN (18,000 lb)
20
Tire Pressure = 480 kPa (70 psi)
0.4
On-Highway Vehicle
10
0.2
0
0
0
20
40
60
80
100
120
140 kPa
Undrained Shear
Strength 0
2
4
6
8
10
12
14
16
18
20
psi
CBR
0
1
2
3
4
Figure 12. Static loading design curves without geotextile from Giroud and Noiray (1981) and
points generated for this report according to method documented in Appendix B.
14


 Previous Page
