in.
m
0.5
)
n.
.)
2 i 6 in i n.) )
(
.
(
2
cm c m m ( (6 in
c
5
r= 1 5 r=5 cm
0.4
r=
15
15
r=
0.3
10
Field Trial:
0.2
r = 5 cm (2 in.)
r = 10 cm (4 in.)
r = 15 cm (6 in.)
5
Su = 30 kPa
(4.4 psi)
0.1
Austin et.al..)
et el
r = 5 cm (2 in.)
Su = 40 kPa
r = 10 cm (4 in.)
(5.8 psi)
0
0
0.5
0.4
15
0.3
10
0.2
.)
Field Trial:
)
5
in. 6 in
(2
(
r = 5 cm (2 in.)
0.1
m cm
5 c 15
r = 10 cm (4 in.)
=
r=
r
r = 15 cm (6 in.)
0
0
1
10
100
1000
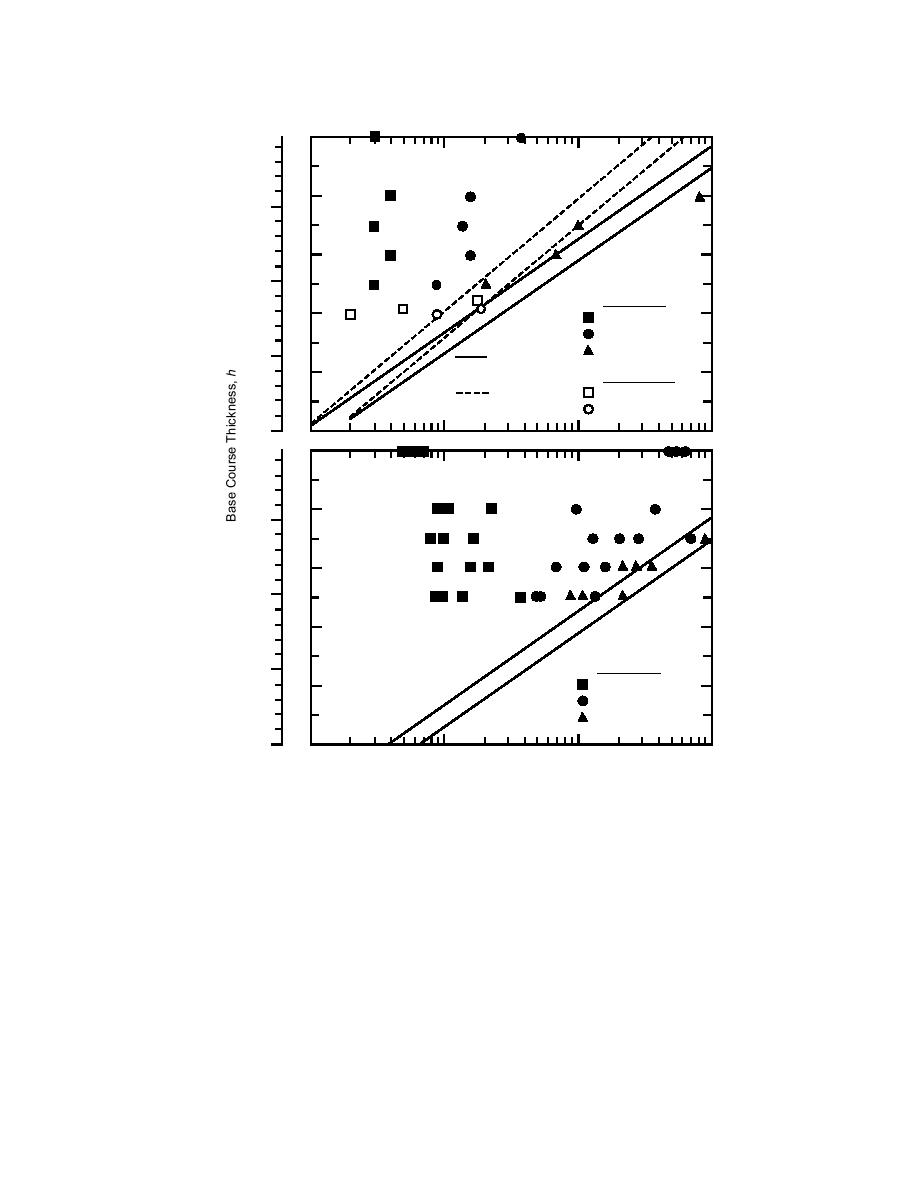
Figure 15. Field performance vs. theoretical prediction by Giroud and Noiray (1981)
for unreinforced test sections (top) and reinforced test sections (bottom). (From
Fannin and Sigurdsson 1996.)
The possibility of using Boussinesq stress dis-
the pressure measured in compacted clay-soil be-
tribution through the aggregate layer could be
low the rock layers was reasonably approximated
added to the Giroud and Noiray (1981) design
by a Boussinesq distribution beneath circular
technique. In addition, shapes other than a circu-
plates. Barenberg et al. (1975) based their theory
larly loaded area should be considered, and work
on tests that utilized "crushed stone aggregate,"
that examines stress distributions through aggre-
and, based on the work of McMahon and Yoder
gates other than crushed rock should also proceed.
(1960), a Boussinesq stress distribution through it
This would allow the confident use of design tech-
is a reasonable assumption for such an aggregate.
niques for relatively low-quality aggregate that
Unfortunately, Steward et al. (1977) did not de-
might be the only option for theater of operations
scribe the aggregate that was used in tests to vali-
date the Barenberg et al. (1975) design method.
military construction.
17


 Previous Page
