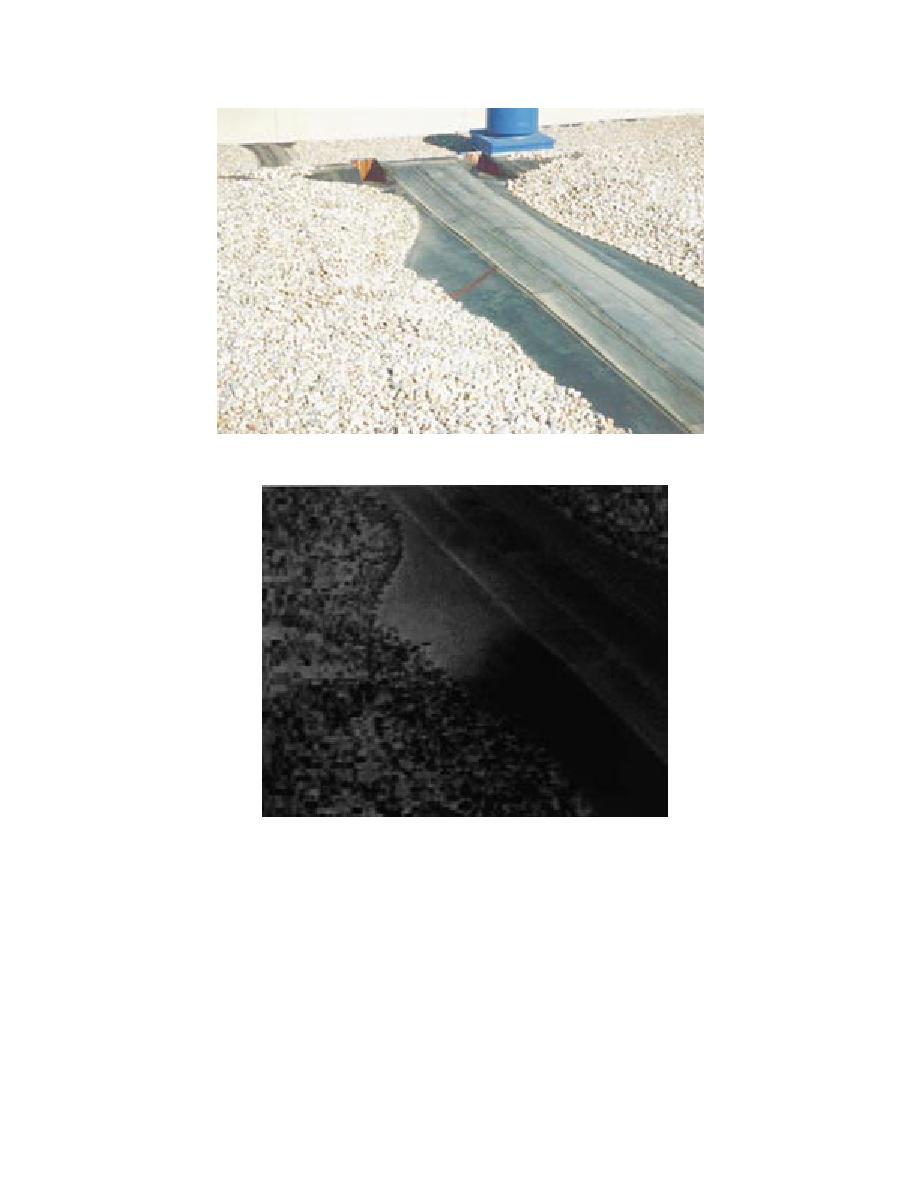
Figure 14. Photograph and thermogram of the east end of the expan-
sion joint at the southeast corner of roof D2. The intense brightness
on the thermogram is probably due to air infiltration, not wet insula-
tion.
ure 14. Figure 15 shows it again along with the
insulation. Our uncertainty is due to differences
bright thermal image that extends from it onto this
in ballast color in this area, which are also, in part,
roof. A few orange spray painted marks were
responsible for the bright thermal images. The
made on the roof to indicate where this bright 2-
owner may wish to investigate this further to de-
ft-wide, 52-ft-long (0.6- 16-m) strip is located. It
termine if wet EPS or wet fibrous glass is present
is parallel to and about 50 ft (15.2 m) from the east
since, as stated for roofs D1 and D2, moisture in
edge of this roof. We did not core the roof in this
each insulation should be responded to in a dif-
area, so we do not know for sure if it contains wet
ferent way. If the EPS is wet, the EPDM membrane
12


 Previous Page
