220
0
115
5
110
0
Moisture Content
Moisture Content
5
5
Tempererurture
Temp ata e
0
0
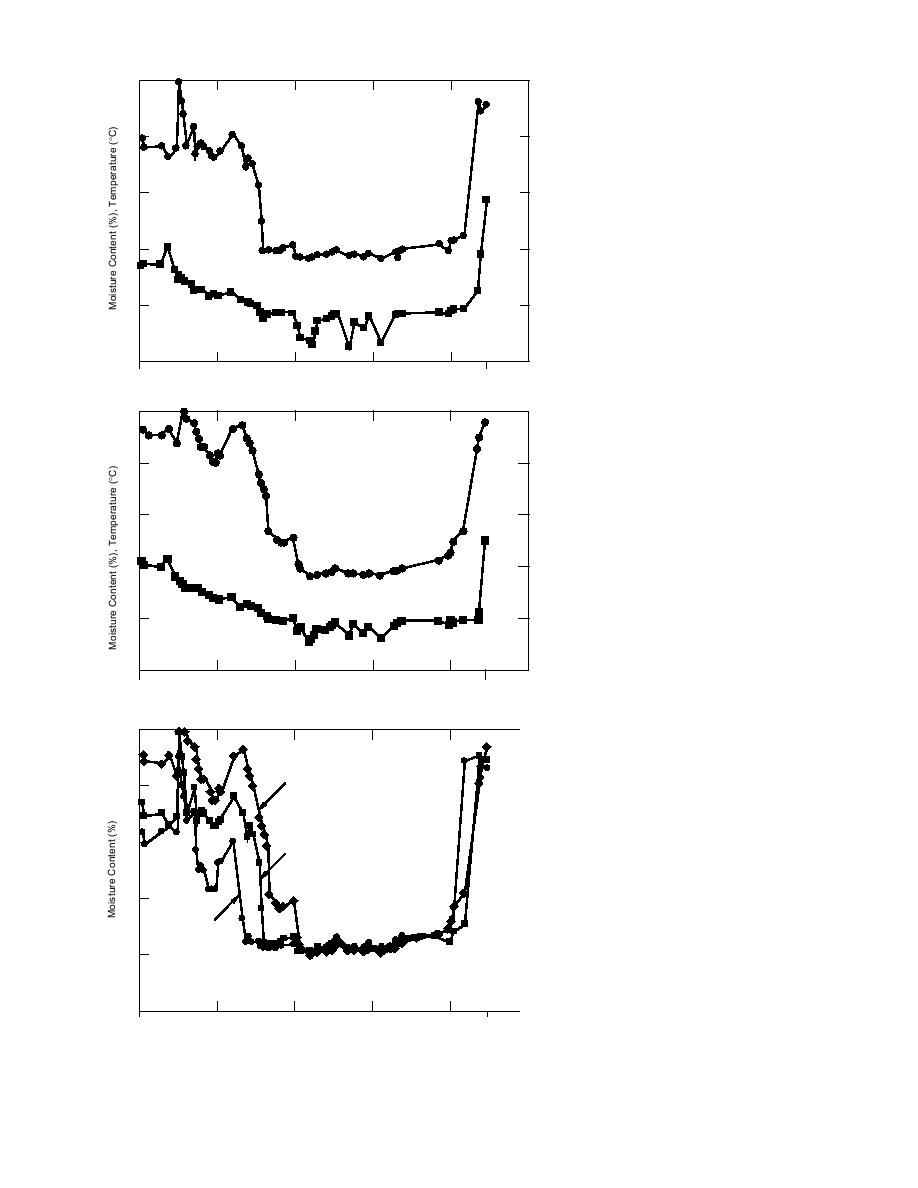
Figure 5. Temperature and percent dry
-5
5
weight vs. elapsed days at 12-in. depth;
0
32
32
64
64
96
128
12 8
160
16 0
0
96
GSB site.
19 Nov 1990
10 Apr 1991
Elapsed Days
Elapsed Days
20
15
10
Moisture Content
5
Temperature
0
Figure 6. Temperature and percent dry
5
weight vs. elapsed days at 18-in. depth;
0
32
64
96
128
160
GSB site.
Nov 1990
10 Apr 1991
Ellapsed Days
Ea psed Days
20
20
18 in. . Depth
18 inDepth
16
16
12
12
12 in. .Depth th
2 in Dep
8
8
6 6nin.Depth
i . Depth
4
4
0
0
Figure 7. Moisture content vs. elapsed
0
32
64
96
128
160
1 60
0
32
64
96
128
days at all three depths; GSB site.
19 Nov 1990
10 Apr 1991
Elapsed Days
Elapsed Days
14


 Previous Page
