suring a capacitance and relating that capacitance
e (ln εc ) / 2.174 - 1.471
θ=
to the soil moisture through an intermediate cal-
.
6.52
culation of the dielectric constant. It would also
have been possible to generate calibration curves
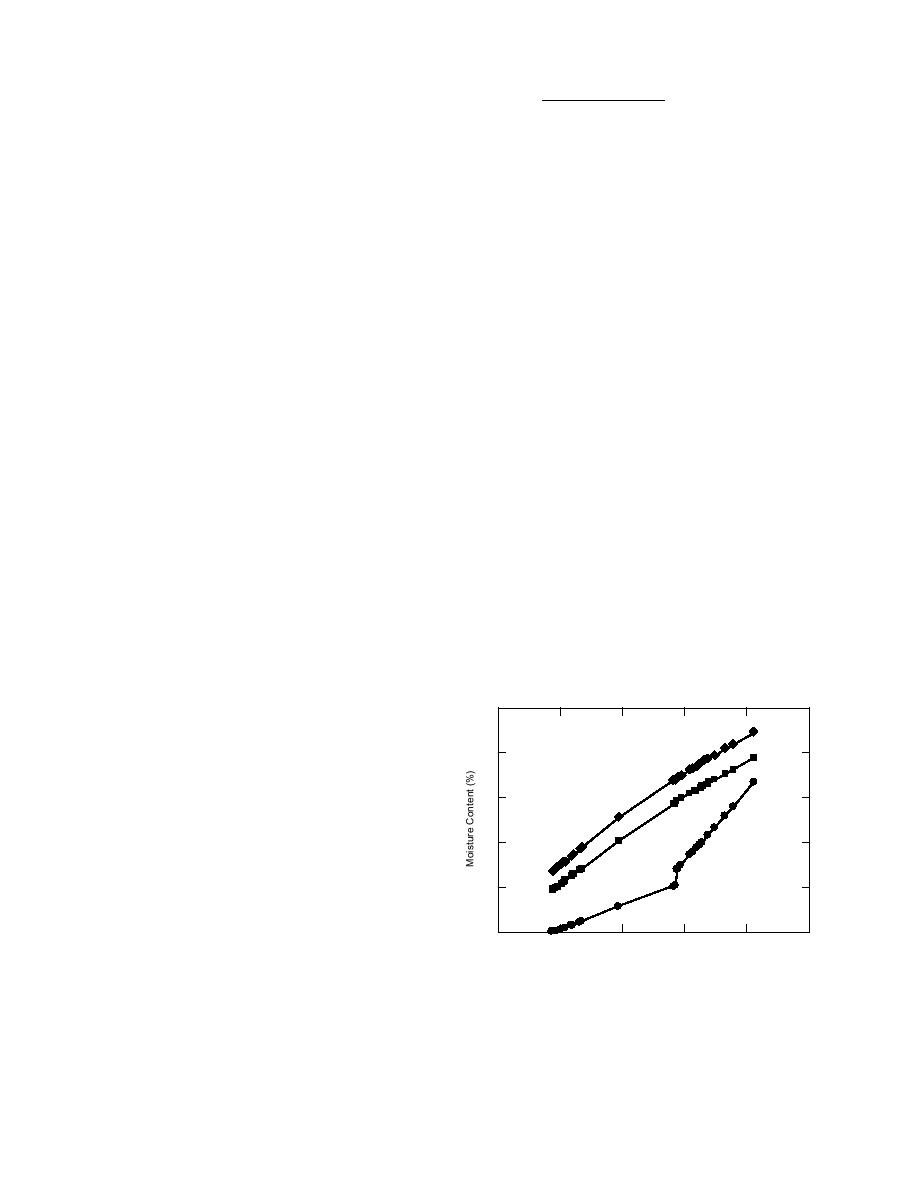
The data in Table 14 were also used to generate
that related the capacitance directly to the soil
the curves of soil moisture (percent by volume)
moisture. If this procedure were followed, then
vs. dielectric constant for each of the three equa-
each time this method was used to measure soil
tions shown in Figure 8. The data are from the
moisture a new calibration curve of capacitance
probe at the 6-in. (15.25-cm) depth for the months
vs. soil moisture would have to be made. By us-
of November, December, and January.
ing dielectric constants in the calibration process
While these data show some relationship be-
it may be possible to find a "universal" calibra-
tween the soil moisture as found by each of the
tion equation such as Topp et al. (1980) devel-
three methods, there is nevertheless a sizeable
oped. It may even be possible that the equation of
difference between values calculated by the Topp
Topp and his colleagues will provide sufficient
et al. and Roth et al. equations for the soil mois-
accuracy to be applied directly to the data gener-
ture and those the calibration runs measure for
ated in this field test program. The original paper
the soil moisture content. The most probable ex-
by Topp et al. (1980) refers to earlier work in
planation of why Topp et al. and Roth et al. agree
which the frequency dependency of the measure-
quite closely but differ by a substantial amount
ments was examined:
from the calibration runs is explained below.
Both Topp and Roth used time domain reflec-
The variables which affect the electrical re-
tometry (TDR) to determine the dielectric con-
sponse in soils are texture, structure, soluble
stant; this method is essentially a pulsed
salts, water content, temperature, density,
and measurement frequency. Over the fre-
(high-frequency) velocity measurement method,
quency range of 1 MHz to 1 GHz the real
so these relatively low-frequency (10-MHz) ca-
part of the dielectric constant does not ap-
pacitance measurements would produce dielec-
pear to be strongly frequency dependent
tric constants that would be too large for the TDR
[Davis and Annan, 1977]. It is therefore un-
equations. These large dielectric constants from
likely that there exists any relaxation mecha-
the capacitance measurements would thus produce
nisms which impart strong temperature
dependence to the real dielectric constant K′.
too large a moisture content measurement using
Davis and Annan [1977] also indicated that
TDR equations. (Note that the dielectric constant
the dielectric loss K′′ was considerably less
for soilwaterair mixtures decreases as the mea-
than K′ in this frequency range.
surement frequency increases.)
A closely controlled set of soil tests would be
If this is indeed the case, then the 10 MHz
measurements taken in this field test program fit
y
inside the range referred to by Davis and Annan.
36
To examine the possibility that Topp and his
colleagues' equation could be used for calcu-
30
lating the soil moisture in this field test pro-
gram, the calculated dielectric constants were
Roth et al.
used in their equation (eq 4). The resultant soil
24
moistures are shown in Table 14 along with the
average soil moistures as determined by both
18
calibration runs. Table 14 also shows the volu-
Topp et al.
metric soil moisture contents that would have
12
resulted from using the calculated dielectric con-
stants in Roth and his colleagues' equation. For
Calibration Equation
this equation, an average density of 1.425 and a
6
soil specific gravity of 2.70 were used, giving
4
7
10
13
16
19
an average porosity of 47.2%. The soil's dielec-
Dielectric Constant
tric constant was assumed to be 2.40. The use of
Figure 8. Percent moisture content by volume vs. dielec-
these data yielded the following Roth et al. equa-
tric constant according to Topp et al., Roth et al., and
tion:
CRREL calibration equations.
19


 Previous Page
