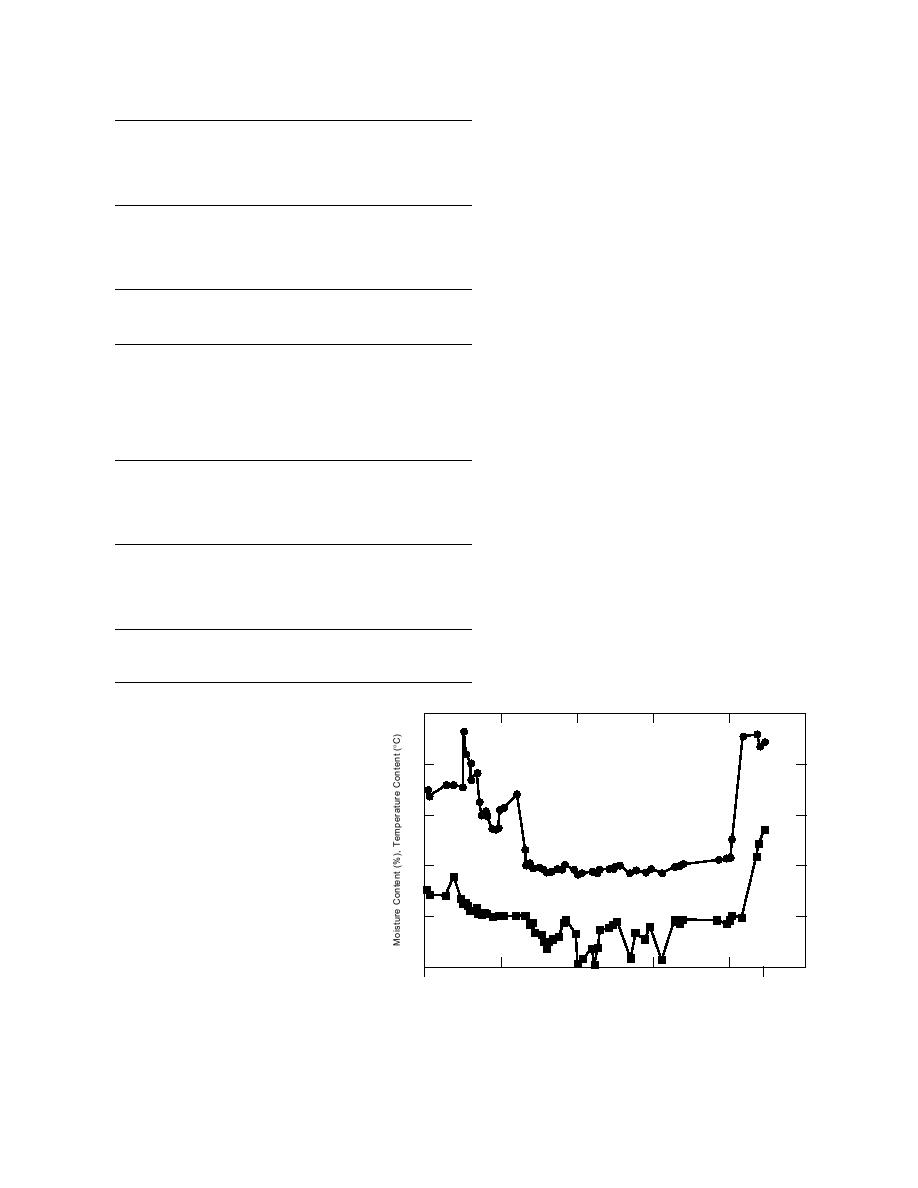
than this rain event, the soil moisture drops off
Table 9. Percent dry weight.
as expected with the sharp decline caused by
Low end
2 to 12.5
Calibration runs
the onset of freezing conditions. As expected,
the probe at the 6-in. depth froze first, followed
Run 2
%DW = 0.72834 K 0.89248
10 points
Run 3
%DW = 0.81027 K 0.89230
10 points
r = 0.992
by the 12- and then the 18-in. probes. The curves
Both
%DW = 0.75435 K 0.81060
20 points
r = 0.985
of soil moisture and temperature verify that
this was in fact the case (Fig. 4, 5, and 6).
Midrange
12.6 to 15.7
The data indicate that not all the available
Run 2
%DW = 3.01952 K 29.51577
9 points
r = 0.98
moisture became frozen. Since the coldest tem-
Run 3
%DW = 1.96994 K 14.18193
9 points
r = 0.99
peratures recorded during the entire winter
Both
%DW = 2.23573 K 18.11893
18 points
r = 0.96
never went below 6C (at the 6-in. depth, and
even warmer at the 12- and 18-in. depths), in
High range
15.8 and above
addition to the fact that there were several rain
Run 2
%DW = 1.66865 K 9.29265
4 points
r = 0.99
events during the winter, it is possible that this
Run 3
%DW = 1.65982 K 8.90202
4 points
r = 0.996
is in fact the case. Other researchers have noted
Both
%DW = 1.59654 K 7.94469
8 points
r = 0.99
that unfrozen water exists in soils below 0C.
K = measured dielectric constants
The curves in Figures 4 through 7 and the
percent soil moisture contents shown in Tables
11, 12, and 13 are based on the dry soil densities
Table 10. Percent volume.
of the test soils in the calibration jig, not on the
dry soil densities at the test site. For example, a
Low end
2 to 12.5
Calibration runs
typical dry density for soils in the test site area
Run 2
%V = 1.00431 K 1.27854
n = 10
r = 0.990
might be 1.7 or so. If this density is representa-
Run 3
%V = 1.20894 K 1.36324
n = 10
r = 0.992
tive of the site, then all soil moisture contents
Both
%V = 1.07080 K 1.12668
n = 20
r = 0.973
shown in these graphs and tables would be too
large and should be reduced by the ratio of the
Midrange
12.6 to 15.7
calibration densities to the test site densities
Run 2
%V = 4.16044 K 40.74224
n =9
r = 0.982
(1.425/1.7, or 0.838 on average). Note that a
Run 3
%V = 2.93798 K 21.23448
n =9
r = 0.997
year later it is still possible to correct the soil
Both
%V = 3.08706 K 24.40191
n = 18
r = 0.920
moisture figures in these graphs and tables just
High range
15.8 and above
by finding the average dry density of the soil at
the test site.
Run 2
%V = 2.30714 K 13.04434
n=4
r = 0.997
The data from these tests are actual soil
Run 3
%V = 2.47365 K 13.38361
n=4
r = 0.997
Both
%V = 1.68080 K 1.165411
n=8
r = 0.702
moisture measurements determined by mea-
20
TEST RESULTS
Using the procedure described,
15
curves of soil moisture in percent dry
weight vs. elapsed time for 6, 12, and
18 in. are shown in Figures 4, 5, and 6.
10
The temperature data are also shown
for each depth. The data used to gen-
Moisture Content
erate these curves are in Tables 11, 12,
5
and 13. Figure 7 presents a comparison
of moisture content at the three depths
Temperature
during the entire freezethaw cycle of
0
the winter season.
All three summation curves in Fig-
ure 7 show a gradual decline in mois-
5
ture content, starting in early Decem-
0
32
64
96
128
160
19 Nov 1990
10 Apr 1991
Elapsed Days
ber, that takes a sudden sharp rise in
mid-December due to a heavy rain that
Figure 4. Temperature and percent dry weight vs. elapsed days at 6-in.
occurred over a 36-hour period. Other
depth; GSB site.
13


 Previous Page
