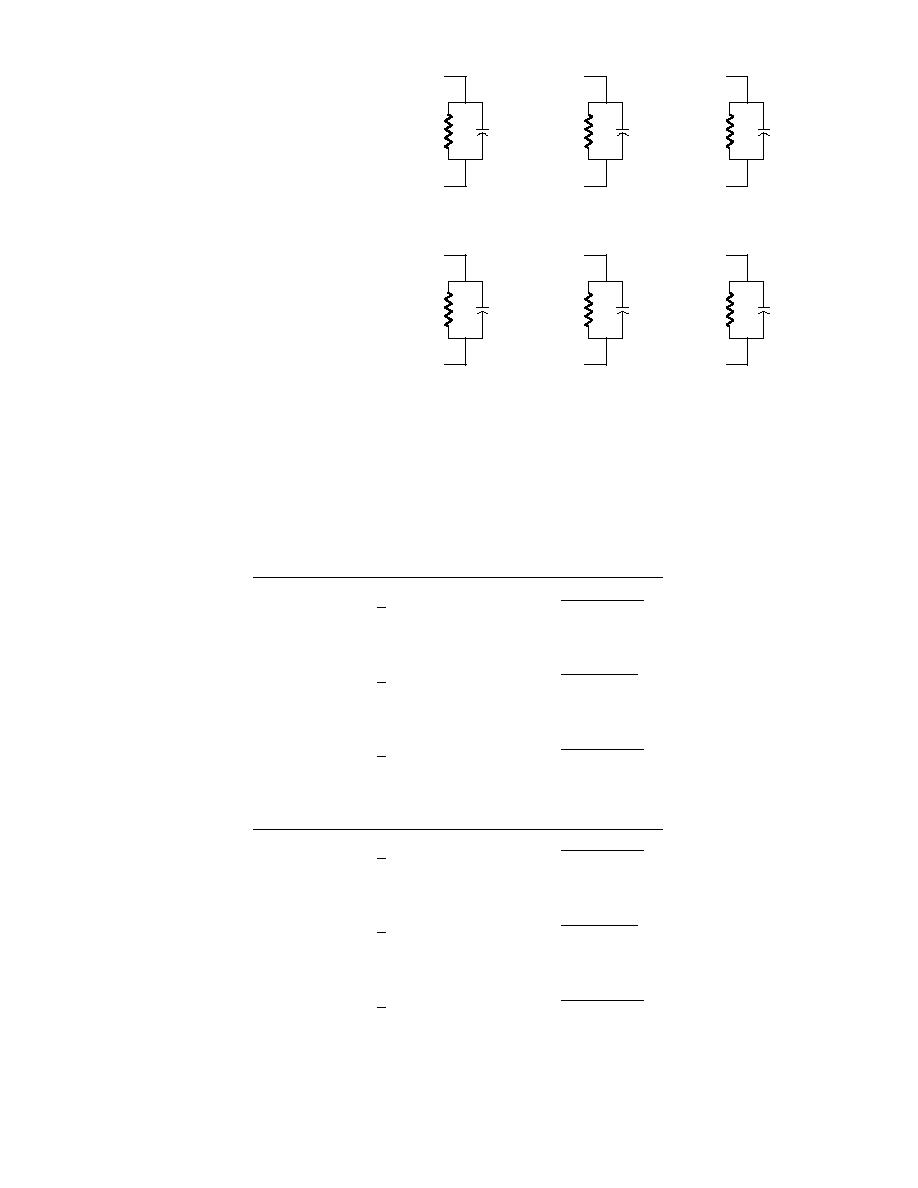
Measurement electronics consisting
of two separate circuits but installed
in a single chassis (box). Three such
261.5 Ω
152.3 pF
2.49 K
105.8 pF
8.08 K
10.6 pF
boxes were tested, with each box
containing two separate measuring
circuits. For ease of identification,
the boxes were simply called box 2,
box 3, and box 4. For each box, the
two separate measurement circuits
are called probe 1 circuit and probe
circuit 2.
Test circuits as shown in Figure 3
are identified by their actual capaci-
261 Ω
147.2 pF
2.49 K
94.4 pF
8.07 K
16.1 pF
tance value (152.3 pF, for example).
One box (box 3) was left unnulled
in the second set of tests just to pro-
vide some comparison to the nulled
Figure 3. Resistancecapacitance (RC) network circuits.
cable measurements.
The initial measurement procedure
consisted of nulling the cable capacitance of the
taken for each circuit and each RC network. As an
test boxes and then connecting each of the test RC
illustration, the raw data from the autumn tests
networks to each measurement circuit (probe 1
are shown in Appendix A. A summary of all the
and probe 2), with readings of Vref, Vdiv, and Vph
test results are shown in Table 2a and b.
Table 2a. Statistical summaries: Preliminary tests (spring 1991).
Box 2
Both probe circuits nulled
152.3 pF circuit
n = 8 C = 157.0 pF
s = 8.5
% standard deviation = 5.4
% error = 3.0
10.6 pF circuit
n = 8 C = 14.8 pF
s = 2.2
% standard deviation = 14.8
% error = 39.6
105.8 pF circuit
n = 8 C = 127.0 pF
s = 0.41
% standard deviation = 0.3
% error = 20.0
Box 3
Both probe circuits nulled
152.3 pF circuit
n = 7 C = 208.2 pF
s = 5.2
% standard deviation = 2.5
% error = 36.7
10.6 pF circuit
n = 7 C = 16.3 pF
s = 0.72
% standard deviation = 4.4
% error = 53.8
105.8 pF circuit
n = 7 C = 3.17 pF
s = 0.41
% standard deviation = 2.4
% error = 25.6
5


 Previous Page
