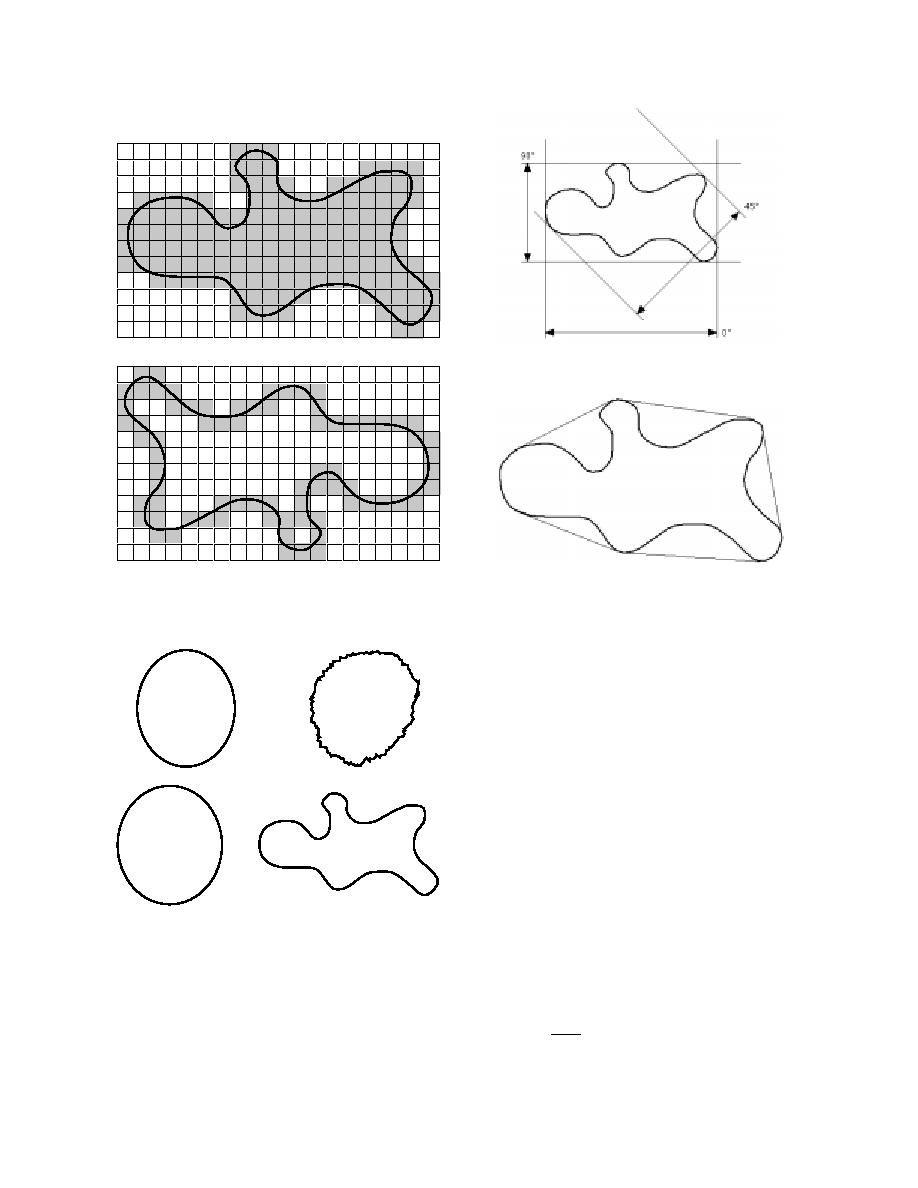
c. Typical feret measurement.
a. Area of an aggregate calculated through image analysis.
d. Illustration of convex perimeter.
b. Perimeter of an aggregate calculated through image anal-
ysis.
Figure 10. Material characterization using image analysis.
area of an aggregate is the sum of pixels present
within the aggregate boundary (Fig. 10a). The
perimeter is the sum of pixels surrounding the
aggregate (Fig. 10b). Ferets are straight-line meas-
1.00
1.12
urements made between two tangents (Fig. 10c).
In this particular case, eight feret measurements
are taken at 0, 22.5, 45, 67.5, 90, 112.5, 135, and 157.5
a. Roughness.
degrees. From these measurements, indices for
roundness and roughness are derived. For exam-
ple, the length and width of the aggregate are the
longest and shortest feret measurements taken at
95
62
the various angles mentioned above, respectively.
The roughness is defined as the ratio of the
perimeter to the convex perimeter. The convex
perimeter is defined as the string measurement
b. Roundness.
around the tips of the eight ferets (Fig. 10d). For a
smooth material, the roughness factor equals
Figure 11. Definition of roughness and roundness.
1.00. As the roughness increases, the roughness
factor also increases (Fig. 11a).
The numbers on these figures are used to iden-
The roundness is defined as follows:
tify the measurements of the individual aggre-
gates during the analysis process. The following
4πA
Rn =
basic measurements were made: 1) feature area,
P2
2) feature perimeter, 3) feature ferets, and 4) x-y
coordinates. In the image analysis method, the
where Rn = roundness index
6


 Previous Page
