the Vermont Agency of Transportation (VAOT)
face of the aggregate. The remaining asphalt on
the aggregate is used as an indicator of the sur-
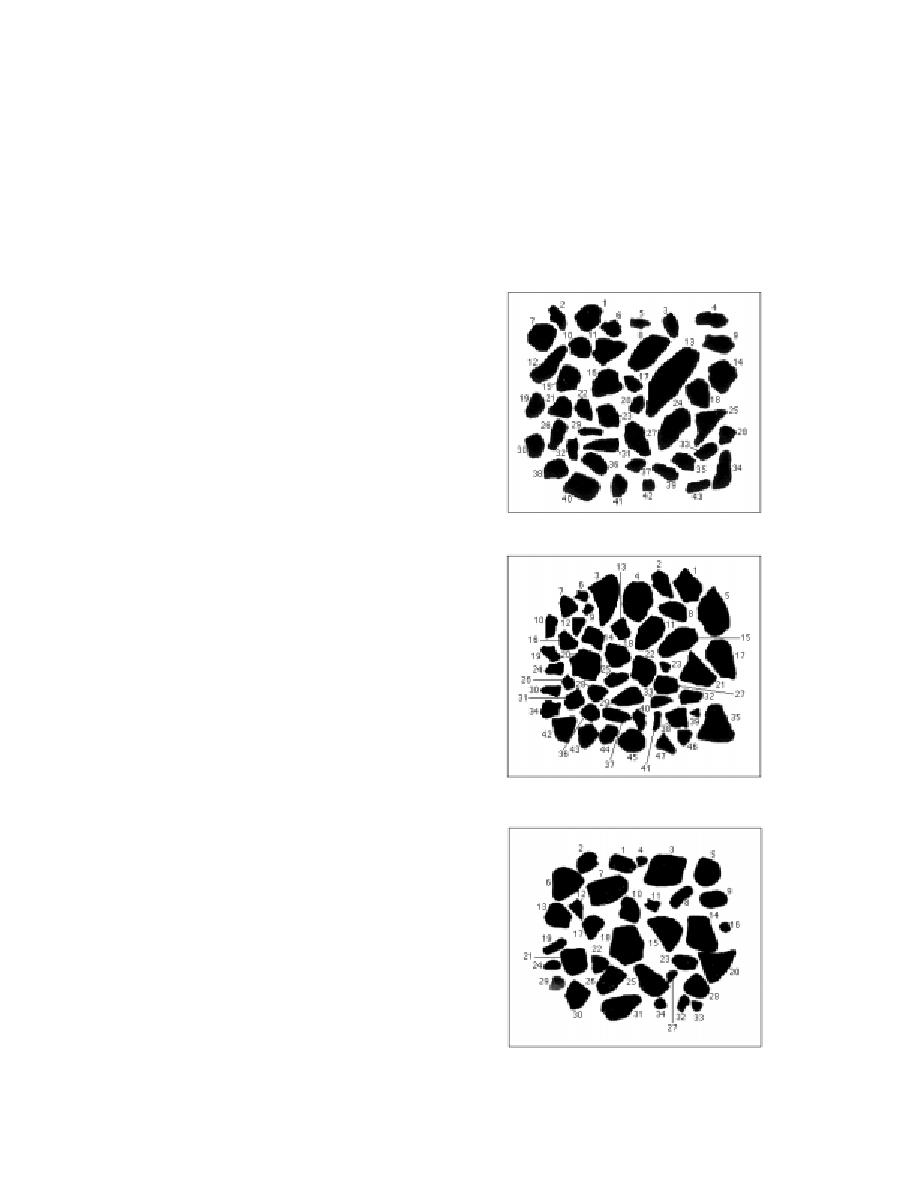
were characterized using the QMOT image analy-
face texture. This method determines the micro-
sis system. The samples included one sample of
texture of the surface and the absorptive nature of
crushed gravel and two samples of crushed
the aggregate and is still an index to the rough-
stone. The crushed stone was obtained from two
ness of the surface.
different sources. Roughly thirty to forty ran-
Wright (1955) developed a method for quanti-
domly selected aggregates were placed on a light
fying the surface texture of concrete aggregate
table and videotaped. The outlines of aggregates
particles using studies done on 19-mm stones.
from the three sources, as reproduced by the im-
The test aggregates were first embedded in a syn-
age analysis program, are shown in Figures 7 to 9.
thetic resin. Once the resin hardened, the stones
were cut into thin sections (approximately 2.5
102 mm thick). The thin section was placed un-
der a projection microscope and magnified 125
times. The unevenness of the surface was traced
and the total length of the trace was measured.
This length was then compared with an uneven
line drawn as a series of chords (Fig. 6). The
difference between these two lines was defined as
the roughness factor. The reproducibility of this
method was reported to be good (Wright 1955).
However, to obtain a reliable average of rough-
ness of any one aggregate size, it is necessary to
Figure 7. Image of the Pike crushed stone
take many sample measurements.
prior to image analysis.
Determination of aggregate characteristics
using image analysis
The direct measurement methods described in
the previous sections are time consuming and
labor intensive. Thanks to the power of present
computing capabilities, computer-based image
analysis has been developed for analyzing aggre-
gate shape, angularity, and roughness. A feasibil-
ity study was conducted for the Federal Highway
Administration (FHWA) on this technology (Wil-
son et al. 1995). The study was conducted on fine
sands (manufactured versus natural), and the
conclusion was that image analysis was a viable
Figure 8. Image of the crushed stone prior
tool for distinguishing the shape and angularity
to image analysis.
of the particles. Wilson et al. (1995) developed the
Roundness and Shape Indices to quantify the
roundness and angularity of the particles, re-
spectively. The method first involves capturing
images of the aggregates using a high-resolution
video camera. Then an image analysis computer
program is used to identify, separate, and trace
the edges of the aggregates. Based on the traces,
algorithms in the programs are used to determine
the different characteristics of the aggregates.
The Quebec Ministry of Transportation
(QMOT) uses image analysis on a routine basis
for verifying the angularity of its hot mix aggre-
gates. To study the feasibility of this method,
Figure 9. Image of the crushed gravel prior
samples of base course aggregates obtained from
to image analysis.
5


 Previous Page
