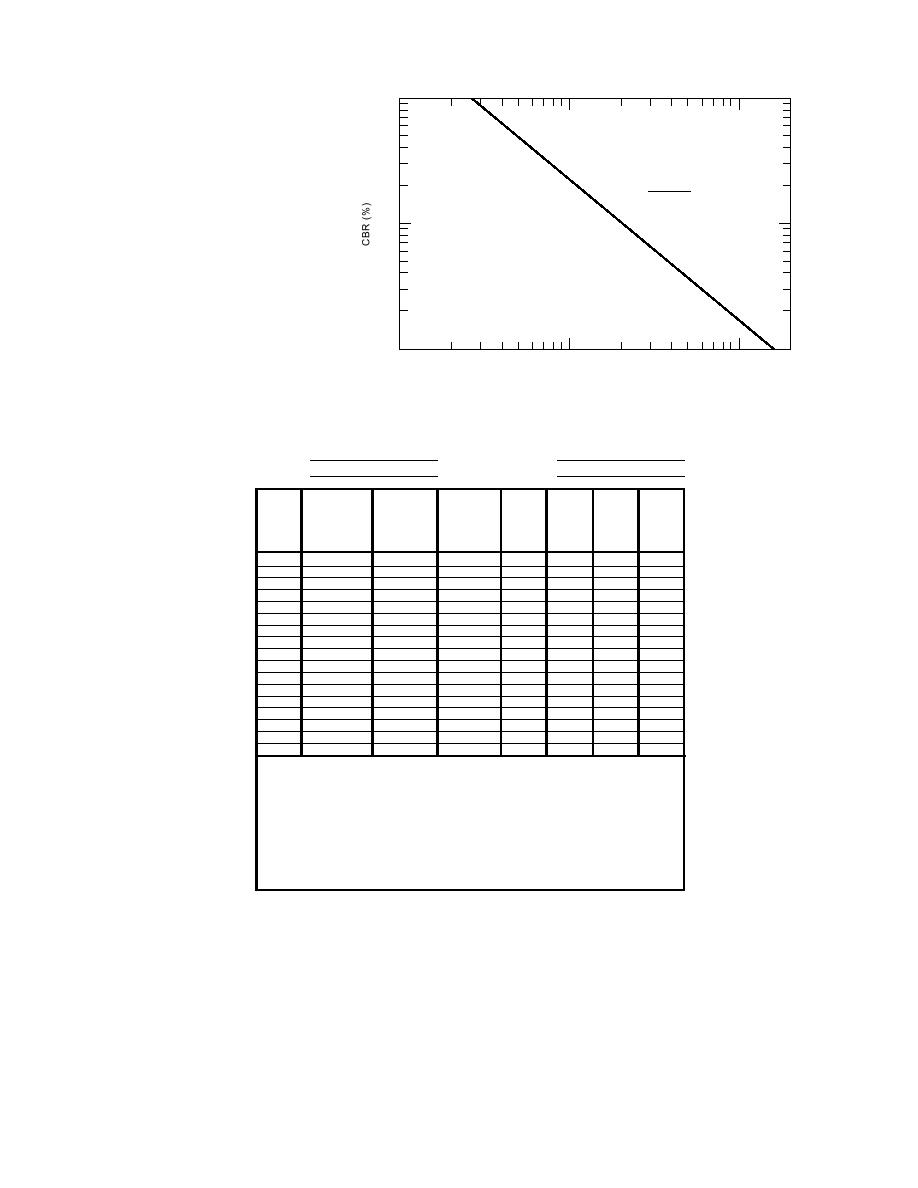
the correlation of CBR vs. DCP to
100
produce eq 3:
CBR = 292/DCP1.12.
(3)
The DCP data are recorded as the
292
CBR =
number of blows needed to drive
DCP1.12
the penetrometer in increments of
10
not less than 25 mm of penetra-
tion. Figure 8 (Kessler Soils Engi-
neering Products 1996) is a sample
of a typical data sheet. When the
maximum penetration has been
reached, the DCP is removed from
the hole by driving the sliding
1
weight against the top handle.
1
10
100
200
Disposable cones were used dur-
DCP Index (mm/blow)
ing the spring field testing to min-
Figure 7. Correlation plot of CBR vs. DCP index.
imize wear and tear on the equip-
ment.
RayayararSupereufndd See
R mmk k Sup fr un Sitit
March 12,, 1997
h 12 1997
Projroject
P ect
Datte
Da e
LoLociatnon Siteit3 Norohth +000
S e 3 N t r 0 0+0
stabiliized wasttemateeiraal
zed wase mat r i l
cat o i
SoiilType(s)
Sol Type
No. o.fofAccccumulavie e Penetrtatition Peenerraton Hamm er
No
A umulati t v Pene raon P nettatiion Hamm
DCP
CBR
Deephh
D ptt
CBR
bws s penetearaoin n per r loow set peerblow
low
penr t ti t o
pebblw set
p r blow
bllow
b ow
index
index
((%)
%)
(in))
blo
(in
(mm)
(mm)
(mm)
f actor
factor
(mm)
(mm)
(mm)
(1)(1)
(2(2)
(3) )
(3
(4))
(4
((5)
5)
(6)
((7)
7)
(88)
()
)
(6)
0 0
00
------
-----
---
1
-----
---
00
----
--
1
----
3 3
25 5
2
255
2
8..3
83
1
27
1100
..
8.3
1
27
8.3
1010
55 5
5
300
3
330
..0
1
85
2.2
3.0
1
85
2.2
3.0
10
80
25
2.5
1
105
3.1
2.5
10
80
25
2.5
1
105
3.1
2.5
10
110
30
3.0
1
85
4.3
3.0
10
110
30
3.0
1
85
4.3
3.0
15
150
40
2.7
1
97
5.9
2.7
15
150
40
2.7
1
97
5.9
2.7
10
190
40
4.0
1
62
7.5
4.0
1010
190 0
400
440
..0
1
62
9715
..
4.0
23
4
1
62
4.0
1010
230 0
400
440
..0
1
62
10 1
9..6
4.0
27
4
1
62
4.0
1010
270 0
400
460
..0
1
62
11006
3. .
4.0
33
6
1
39
6.0
1010
330 0
600
660
..0
1
39
15. .
1340
6.0
39
6
1
39
6.0
10 8
390 5
605
650
..6
1
39
11514
7. .
6.0
43
4
1
42
5.6
8 8
435 0
455
556
..6
1
42
18. .
1791
5.6
48
4
1
42
5.6
8
480
45
5.6
1
42
18.9
5.6
(1)
No. of hammer blows between test readings
(1)(2)
No.ccfuhaulative lconespbetwreeinnester eachgset of hammer blows
A o m mmer bow enet at o t af readin s
(2)(3)
Acciufmrulncieencaccumunattiratipenafttrertiench)sattstartamd end lofws mmer set
D f e eat v i one pe l e ve on e a oa (2 e of h anmer b o ha
(3)(4)
Di(ferdincdeid by c1)mulative penetration (2) at start and end of hammer set
f3) e vi e n ac( u
(4)(5)
(3) ditvir 1doby 716 lb hammer; 2 for 10.1 lb hammer
En ede f r 1( . )
(5)(6)
Enterx1(5)r 17.6 lb hammer; 2 for 10.1 lb hammer
(4) fo
(6)(7)
(4) xo(5)CBR versus DCP correlation
Fr m
(7)(8)
FrPm vious entry is DCPiviorrdlation .4 rounded off to 0.1 in.
ore CBR versu n (2) d c dee by 25
(8)
Previous entry in (2) divided by 25.4 rounded off to 0.1 in.
Figure 8. Example of completed DCP data sheet for the Raymark Superfund site.
in January. The data gathered from the thermo-
TEMPERATURE DATA AND ANALYSIS
couples were used to determine whether 910 mm
of material was a sufficient thickness to prevent
Thermocouples were installed at the site in
frost penetration into the stabilized waste mater-
December/January at four locations (see Fig. 1:
ial.
thermocouple sites 10, 20, 30 and 40) and recorded
At sites 10 and 20, the thermocouple strings
data throughout the freezing season. Thermocou-
were installed into the Tilcon common granular
ples were installed during December at sites 10,
fill material. Site 30 was located in another sub-
20 and 30. Site 40 was installed during a site visit
5


 Previous Page
