Clegg impact hammer
(ASTM) "Modified Proctor" test (ASTM D1557-91).
The Clegg hammer was used to determine the
The hammer is raised in the guide tube until a
unconfined compressive strength of the stabi-
white line etched on the hammer is even with the
lized waste material at all three test locations. Fig-
top of the tube; this ensures that the proper drop
ure 3 illustrates the Clegg hammer, which con-
height of 450 mm is maintained. An accelerometer
sists of a 4.5-kg compaction hammer, a guide
built into the hammer measures the peak decelera-
tube, and an electronic display. The weight of the
tion of the hammer when it impacts the soil sur-
hammer is based on the hammer used in the
face. The hammer is dropped four times at each
American Society for Testing and Materials
test point. The electronic display shows the high-
est deceleration value at each point as a Clegg im-
pact value (CIV).
Okamoto et al. (1991) performed a study using
six soil types with varying cement contents rang-
ing from 2 to 16%. The American Association of
State Highway and Transportation Officials
(AASHTO) soil classifications A-1a to A-3, rep-
resenting the range of cohesionless soils, were
compacted at optimum moisture content as deter-
mined by ASTM D533-82, Test Method for Moisture-
Density Relations of Soil-Cement Mixtures. Cylin-
drical specimens were made for testing with the
impact hammer, while companion samples were
made for standard testing of compressive strength
of soil-cement cylinders (ASTM D1633-84). The
samples were tested after 1, 2, 3, 5, 7, 10, 14, and 17
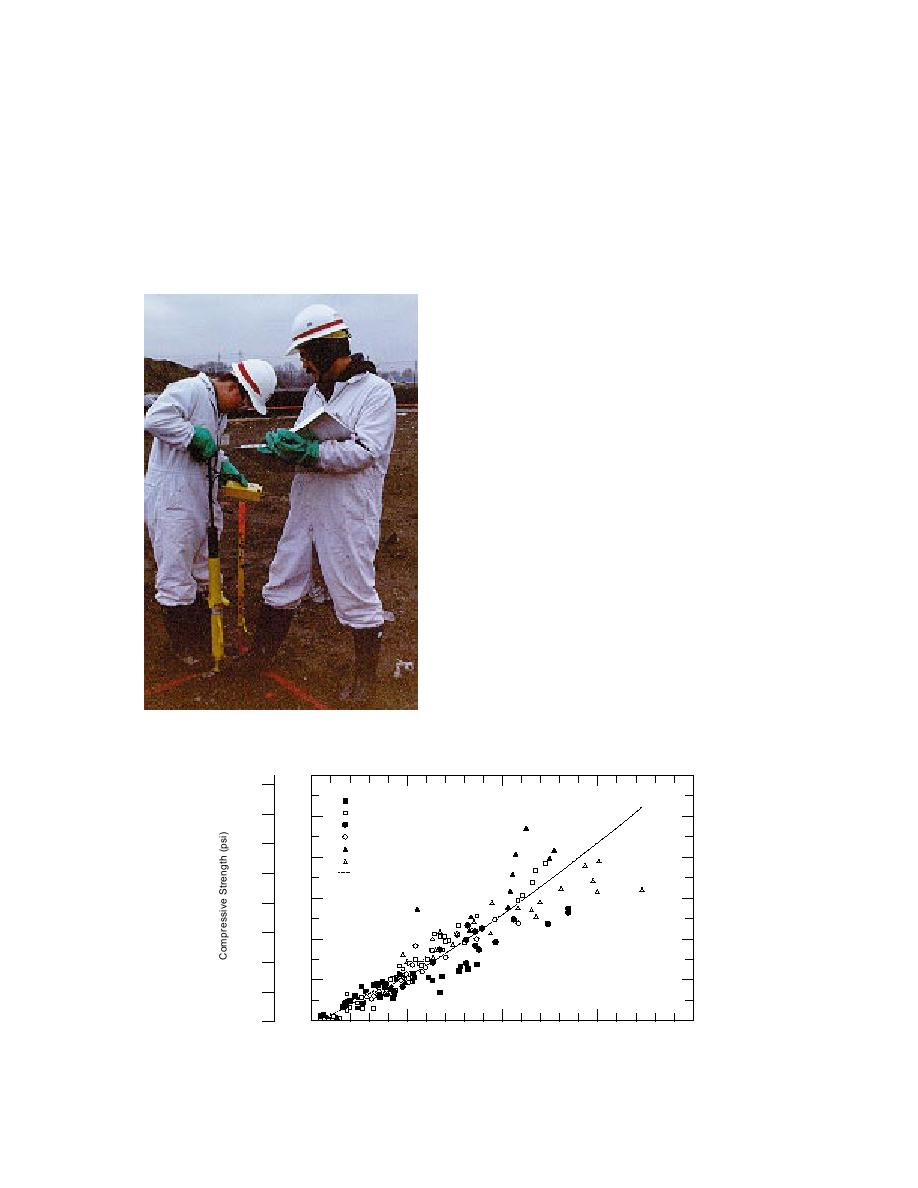
days of curing under wet burlap. A regression
analysis of compressive strength on impact values
was done for the soil types (as shown in Fig. 4).
These data were plotted on a log-log scale and the
95% confidence level was determined (Fig. 5).
With the information from this study, the CIV may
be correlated to unconfined compressive strength
(psi) using eq 1:
()
log fc = 0.081 + 1.309 log(CIV)
′
Figure 3. Clegg impact hammer testing.
(1)
(kPa)
(psi)
1200
8000
Soil 1 A-1-b
Soil 2 A-3
7000
1000
Soil 3 A-1-b
Soil 4 A-2-4
6000
Soil 5 A-1-b
800
Soil 6 A-1-a
Regression
5000
600
4000
3000
400
2000
200
1000
0
0
0
50
100
150
Clegg-Hammer Impact Value
Figure 4. Clegg impact values plotted against compressive strength for all
soils tested.
3


 Previous Page
