Table 6. Comparison of sampling and analytical variance in untransformed and
transformed data for discrete samples.
All
Rows
Rows
Rows
Rows
rows
1 to 3
4 to 6
7 to 9
10 to 12
Untransformed
Ratio of highest conc. to lowest for
discrete samples
172,000
21.2
737
15,800
12,300
Largest conc. ratio for duplicates
20.1
3.65
1.85
10.4
20.1
Transformed
Mean of natural logs
1.45
4.46
1.960
0.013
0.603
Sampling variance of natural logs
17.4
1.42
10.2
16.6
12.5
Analytical variance of natural logs
0.204
0.090
0.046
0.254
0.428
F Ratio
85
16
220
65
29
sions, spatial heterogeneity was always much
first and second sample taken at each node. In
greater than that observed in subsamples of each
general, the ratio of the high to the low mean con-
discrete sample (Table 6).
centration estimate was less then a factor of two
At 5 of the 48 grid nodes, we took a second 120-
(Table 7).
mL sample. Based on the results of a paired t-test
White phosphorus particles were observed at
comparing the means of the analytical replicates,
only four sample points (Table 4), all of which
had concentrations over 5 g/g. The largest num-
no significant difference was found between the
99.99
99.9
99
95
90
80
70
50
30
20
10
5
1
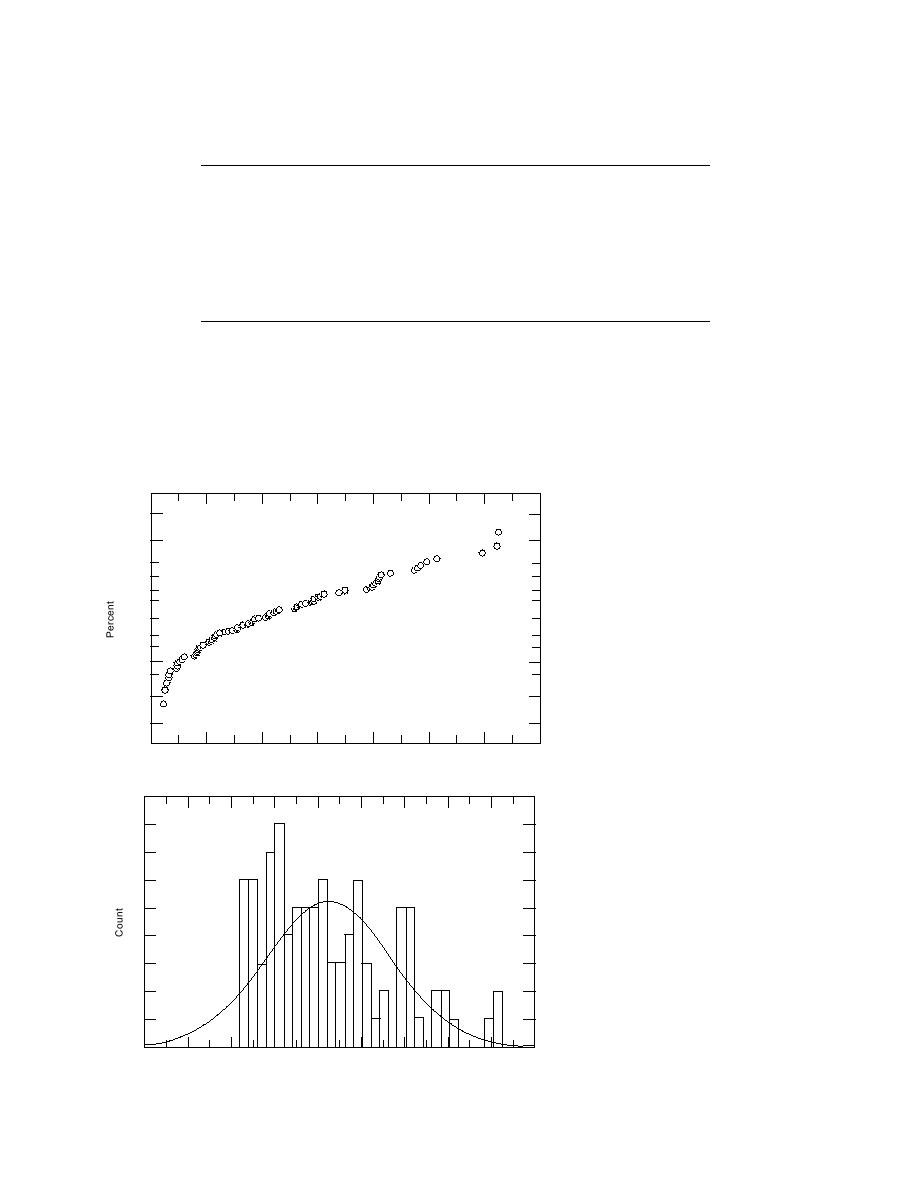
a. Probability plot of data transformed by
0.1
taking the natural logarithm of each value.
0.01
6
4
2
0
2
4
6
8
ln[White Phosphorus Concentration (g/g dry weight)]
9
8
7
6
5
4
3
2
b. Histogram of log-transformed values
1
with Gaussian curve superimposed.
0
10
8
6
4
2
0
2
8
4
6
Figure 6. Log-transformed data.
ln[White Phosphorus Concentration] (g/g dry weight)
11


 Previous Page
