1.0
0.8
0.6
0.4
0.2
0.0
0.0
0.1
0.2
0.3
0.4
0.5
0.6
0.7
0.8
L/G
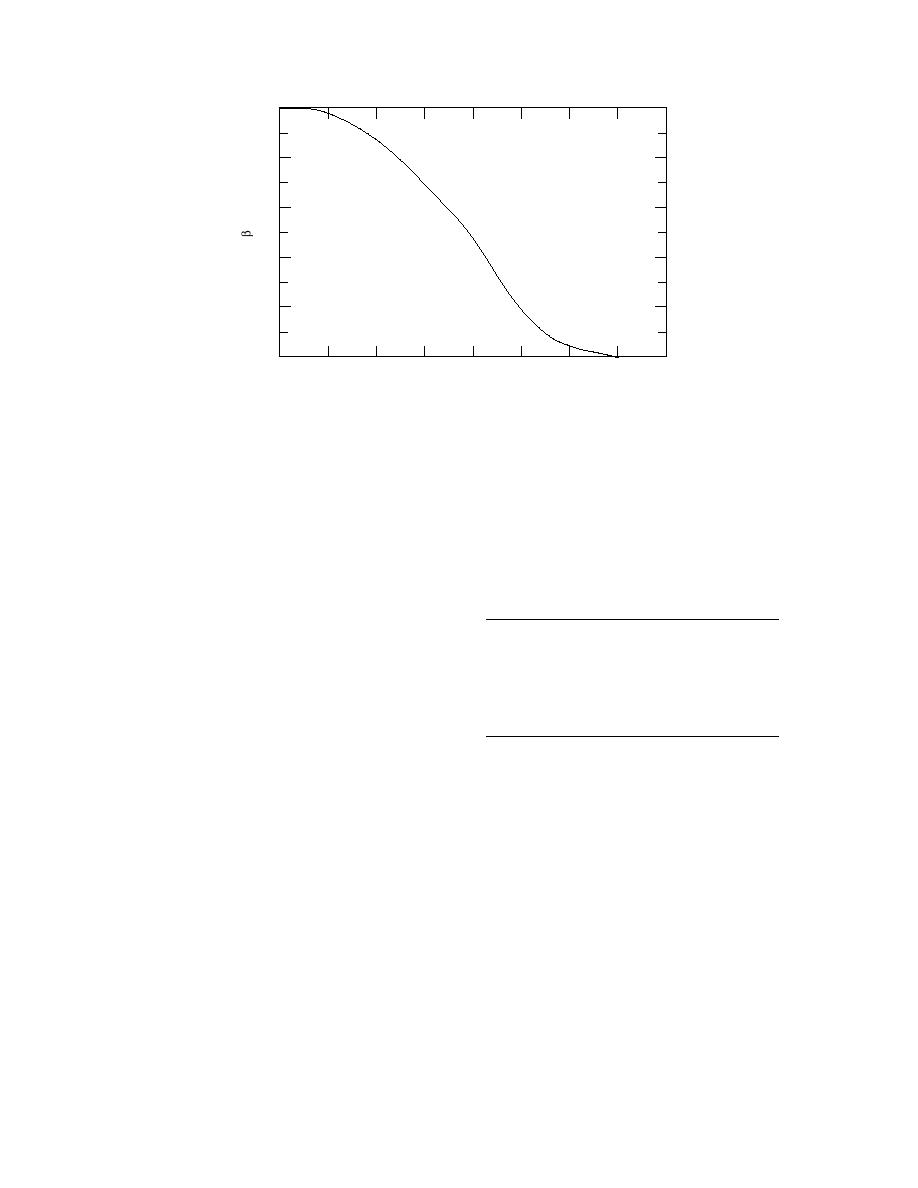
Figure 2. Curve relating L/G, the ratio of the radius of a circular hot spot to
spacing on a square grid, to risk β of not finding a hot spot. (After Gilbert 1987.)
Table 3. Grid shapes and spacings that were
spacing (Gilbert 1987). For this study, stirred
composite samples were collected to obtain a β
used to collect sieved composite samples
from a 7- 20-m area containing DWRC pen 5.
equal to 10%, which corresponds to a grid spac-
Also shown are the number of samples that
ing of 1.82 m for 2-m diameter hot spots. Sieved
made up a composite sample and the total vol-
composite samples were collected for β equal to
ume of sediment that was collected prior to siev-
10, 20, and 40%. Grid spacings ranged from 0.91
ing through a no. 30 mesh.
to 2.33 m for the square grid, and 2.00 to 2.44 m
Grid
Total
for the triangular grid (Table 3).
β
Grid
spacing
No. of
volume
Also, discrete samples were collected on a 1.82-
shape
(%)
(m)
samples
(mL)
m-square grid, which corresponds to β of 10% for
L=1
Square
10
1.82
48
2400
locating a circular hot spot with a radius of 1 m.
L=1
20
1.96
44
2200
These samples were collected to determine the
L=1
40
2.33
36
1800
location of hot spots and to compare the precision
L=1
Triangular
10
2.00
48
2400
of average concentration estimates obtained by
L=1
20
2.17
39
1950
L=1
40
2.44
30
1500
discrete and composite sampling.
L = 0.5
Square
10
0.91
184
9200
Discrete samples
L = One-half length of long axis.
β = Risk of missing a single hot spot.
To relate the results of each of the field com-
positing protocols described below to white
but this time 500-mL sediment samples were
phosphorus concentration found by discrete
taken at each node from the top 9 cm of sediment,
sampling, we obtained individual 120-mL sam-
and four composite samples were formed, each
ples at the nodes of a 1.82-m-square grid for a
containing 6 L of sediment. The first composite
total of 48 samples. In addition, we took replicate
contained sediment from the first three rows (Fig.
samples from five randomly chosen nodes. The
4), the second from the next three, etc.
top 9 cm of sediment was sampled. To maintain
Each composite, having the consistency of a
proper grid spacing, lath was placed at 1.82-m
stiff clay, was homogenized by three mixing proto-
intervals on either side of the area sampled, and a
1.82-m quadrate constructed from 3/4-in. i.d.
cols (Fig. 4). The first protocol was simply mixing
using a long handled spoon in a circular fashion.
CPVC pipe was used to determine each sampling
Intermittently, the composite was divided into
point within the area. Samples were identified by
quarters and each quarter turned over. After 10
row and column designations (Fig. 3). Rows were
minutes of mixing, the sample was flattened and
labeled 1 to 12 and columns 1 to 4 (Fig. 3).
divided into five sections. Five subsamples were
obtained taken by taking a core from the total
Stirred composite samples
thickness of each section. We were careful to
Next, we resampled the 1.82-m square grid,
6


 Previous Page
