ensure that a cylindrical subsample was obtained
8.74
0.989
0.517
0.535
Row 12
to prevent bias. Each subsample weighed
0.435
0.767
0.562
0.643
approximately 40 g (wet sediment).
1m
Because we expected that solid white phos-
671
5.73
2.12
1.08
Row 11
square
629
7.39
0.876
0.811
phorus particles were present in some of the com-
posites, we knew that a truly homogenous sam-
0.0544
0.171
32.0
0.456
Row 10
ple could never be attained by mixing. We next
0.0636
0.152
49.9
0.467
tried sampling the smallest particle size fraction
of the composite. We accomplished this by add-
0.203
0.0975
2.64
0.0987
Row 9
0.240
0.105
2.66
0.0794
ing an equal volume of water (6 L) to the slightly
less than 6 L remaining of each composite sedi-
ment sample (Fig. 4). The 1:1 sediment:water mix-
13.8
9.59
0.0241
1.22
Row 8
9.00
9.40
0.0239
1.27
ture was then stirred for 5 minutes. After a 5-
minute settling time, during which the solid pieces
36.2
0.0655
0.0944
40.7
Row 7
of white phosphorus would fall to the bottom of
377
0.0564
0.0985
72.2
the container, a glass coliwasa was used to obtain
five subsamples made up of four increments from
0.0463
0.0140
0.117
0.0128
Row 6
0.0679
0.0241
0.172
0.0117
the top 11 cm of the water column containing sus-
pended sediment. Finally, we added another 6 L
0.227
8.62
0.870
0.0158
of water to each composite sample to form a 1:2
Row 5
0.251
7.91
1.01
0.0195
sediment:water mixture, stirred, and repeated
the sampling.
0.165
7.04
0.0542
0.0189
Row 4
By sampling the suspended sediment, we dis-
0.169
6.59
0.0293
0.0219
criminate against the largest white phosphorus
particles, which are the cause of poor subsam-
0.130
0.0062
0.0134
0.0244
Row 3
0.126
0.0075
0.0146
0.0155
pling reproducibility. However, these particles
0.0357
0.0039
0.0049
0.0047
Row 2
0.0397
0.0048
0.0063
0.0063
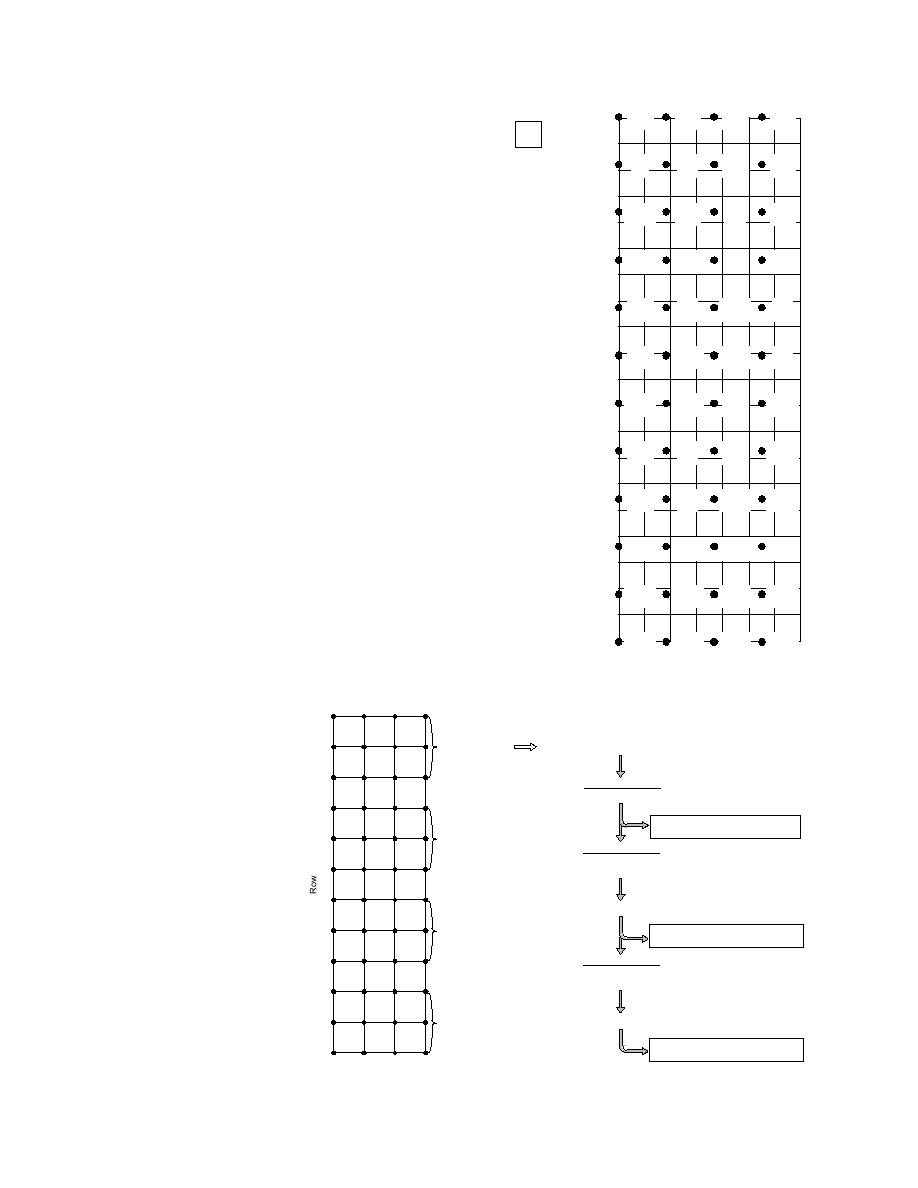
Figure 3. Square grid (1.82 m) pattern used to collect discrete samples in
a 7- 20-m area. The size of the grid was chosen based on a 10% risk of
0.0830
0.0082
0.0040
0.0296
missing a 2-m-diameter hot spot. Samples were taken at the nodes symbolized
Row 1
0.0228
0.0070
0.0043
0.0269
by a solid circle. White phosphorus concentration (g/g) estimates from
Column
Column
Column
Column
duplicate analyses are shown at each circle. Light lines are shown for scale and
1
2
3
4
represent 1 m.
12
12 samples
x
6 L Composite Sample Rows 10-12
11
500 mL/sample
10
Mixing Protocol 1
Manually stirred sediment
9
Fivve~40-g subsamples of
Fi e ~40-g subsa
sttiirred sediment
s rred sedim
8
Mixing Protocol 2
6 L water added to ~ 6 L sediment
7
(1:1 sediment:water)
6
Stir
5
Fiive ~40-g subsa
F ve ~40-g subsamples of
watter and suspend
wa e and suspended sediment
4
Mixing Protocol 3
Additional 6 L water added to form
1:2 sediment:water mixture
3
Stir
2
Figure 4. Mixing protocols and
Five ~40-g subsa
~40-g subsamples of
F
1
subsampling of stirred compos-
watter and suspend
wa e and suspended sediment
1
2
3
4
ite samples
Column
MaW-56
7


 Previous Page
