Table 5. Means, maximums, minimums, medians,
RESULTS
and geometric means for duplicate analyses of
Discrete samples
discrete samples collected on 1.82-m-square grid
White phosphorus was detectable by solvent
grouped by rows to form four subdivisions.
extraction and gas chromatography in every dis-
White phosphorus conc. (g/g)
crete sample taken on the 1.82-m-square grid;
Mean of
concentrations ranged from 0.0039 to 671 g/g
Subsample 1 Subsample 2 subsamples
(Tables 4 and 5, Fig. 3). The lowest concentration
All rows (n = 48)
found was approximately ten times the method
Mean
17.6
24.6
21.1
detection limit.
Max.
671
629
650
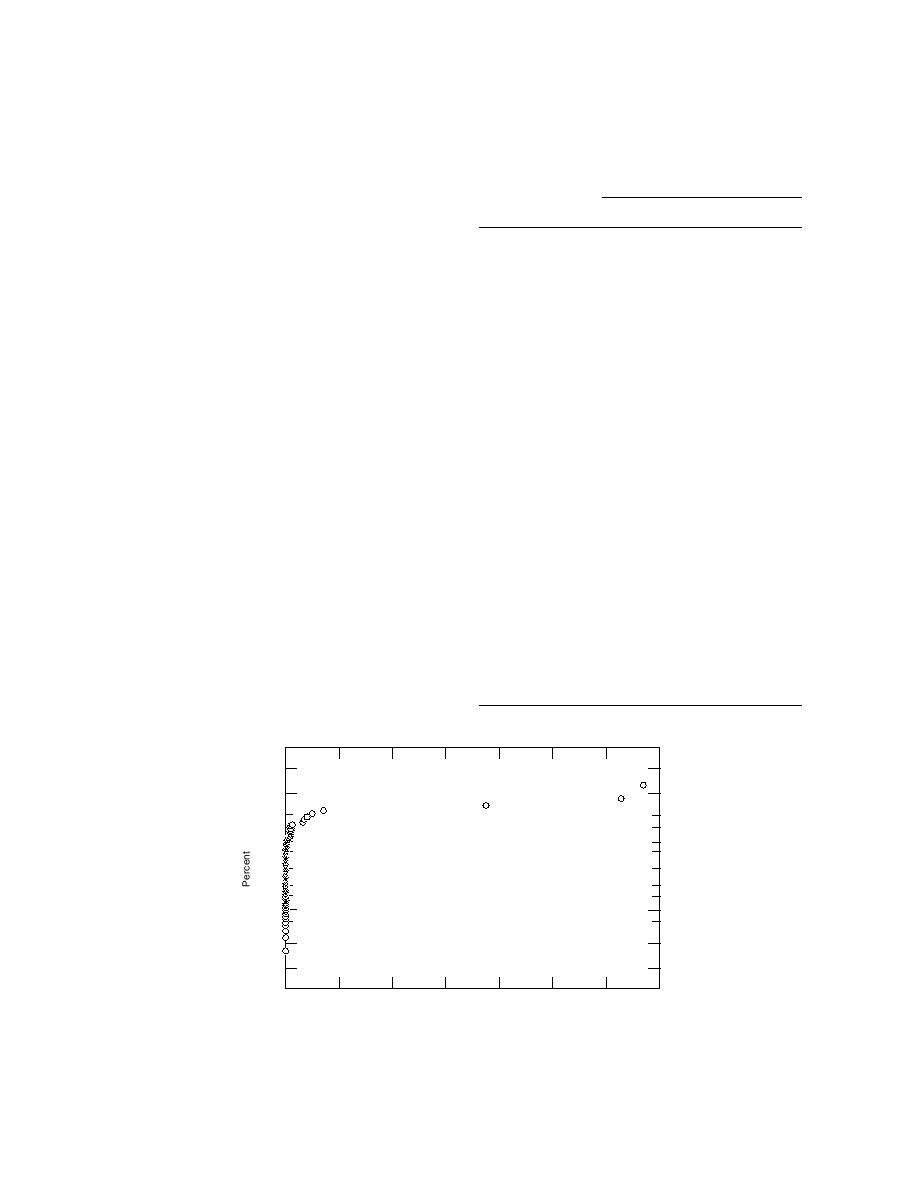
The data were not normally distributed (Fig.
Min.
0.0039
0.0043
0.0042
Median
0.108
0.129
0.123
5), as is common with environmental data for
Geometric mean
0.227
0.223
0.234
low-concentration contaminants, and especially
Rows 1 to 3 (n = 12)
when the dominant form is particulate. Even the
Mean
0.0193
0.0140
0.0166
log-transformed data were skewed (Fig. 6a,b),
Max.
0.0830
0.0397
0.0529
but much closer to normal distribution than the
Min.
0.0039
0.0043
0.0042
untransformed data.
Median
0.0106
0.0100
0.0102
Keeping in mind that the assumption a normal
Geometric mean
0.0117
0.0109
0.0116
distribution is violated by this data set, even
Rows 4 to 6 (n = 12)
when log transforms were used, sampling vari-
Mean
1.43
1.36
1.39
Max.
8.62
7.91
8.26
ance overwhelmed analytical variance (Table 6).
Min.
0.0128
0.0117
0.0122
Even when the data were partitioned by proxim-
Median
0.0856
0.119
0.101
ity into four subdivisions (i.e., rows 1 to 3, rows 4
Geometric mean
0.133
0.146
0.141
to 6, etc.), analytical variance was always less
Rows 7 to 9 (n = 12)
than sampling variance for the log-transformed
Mean
8.74
39.3
24.0
data.
Max.
40.7
377
206
Min.
0.0241
0.0239
0.0240
The degree of spatial heterogeneity in this rela-
Median
0.712
0.755
0.733
tively small area (7 20 m) is evident when we
Geometric mean
0.868
1.06
1.01
consider that the ratio of the highest concentra-
Rows 10 to 12 (n = 12)
tion found to the lowest is over 172,000 (Table 6).
Mean
60.3
57.6
58.9
In contrast, heterogeneity within subsamples of
Max.
671
629
650
the same discrete sample was much less, with 44
Min.
0.0544
0.0636
0.0590
of the 48 pairs within a factor of two. Again,
Median
1.04
0.705
0.913
Geometric mean
1.94
1.45
1.83
grouping the data by proximity into four subdivi-
99.99
99.9
99
95
90
80
70
50
30
20
10
5
1
0.1
0.01
0
100
200
300
400
500
600
700
White Phosphorus Concentration (g/g dry weight)
Figure 5. Probability plot of white phosphorus concentration data obtained
on 1.82-m-square grid. Because the data are not normally distributed, they
do not fall on a straight line.
10


 Previous Page
