method (D TECH), 3) the acetone HPLC method
methods. Here, separate subsamples were ana-
described for HMX analysis, and 4) Method 8330
lyzed and subsampling heterogeneity increased
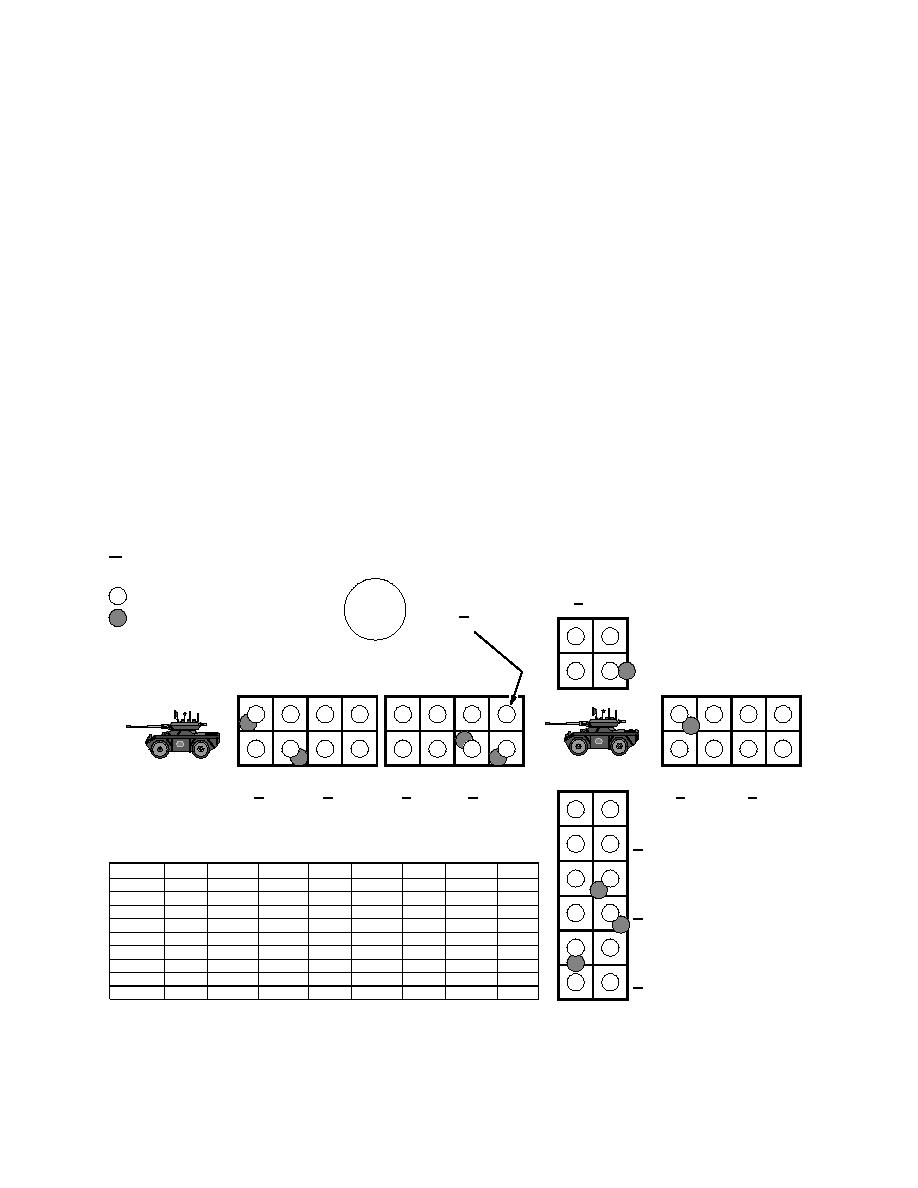
(Table 8). A diagram of the site with on-site colo-
random error. The fact that Method 8330 specifies
rimetric results is presented in Figure 14. Of these,
only 2-g samples would also tend to increase the
concentration estimates for 31 samples were be-
impact of heterogeneity. Nevertheless, the slope
low the detection limit of 0.3 mg/kg by Method
of this relationship is not significantly different
8330 (0.3 mg/kg is also the detection limit for the
from 1.00 at the 95% confidence level which shows
acetone HPLC method), seven had concentrations
that the two methods are not systematically
between 0.3 mg/kg and the 0.5-mg/kg detection
biased. It is clear that the 30-minute on-site extrac-
limit for the D TECH method, nine had concen-
tion with acetone provided equivalent extraction
trations between 0.6 and 0.9 mg/kg, the detection
efficiency for these soils to that for Method 8330,
limit for the Ensys colorimetric method, and 36
which is an 18-hour ultrasonic extraction using
had concentrations at or above 1.0 mg/kg.
acetonitrile.
An assessment of the apparent rate of false
positives and false negatives produced by the on-
Concentration estimates
site and acetone HPLC methods, relative to the
for TNT in subgrid and
Method 8330, results is presented in Table 9. Of
grid-composite samples
As noted earlier, TNT concentration estimates
the 36 samples with concentration estimates at or
using on-site methods were much lower than for
above 1.0 mg/kg by Method 8330, 32 were posi-
tive using the EnSys colorimetric method and only
HMX at CFB-Valcartier. Samples (n = 83) used to
four were apparent false negatives. Likewise for
assess short-range heterogeneity, as well as
the D TECH immunoassay method, 45 samples
subgrid and grid-composite samples were also
were found to be above the detection limit of 0.5
analyzed for TNT using 1) an on-site colorimetric
mg/kg, and of these, 10 were classified as appar-
method (EnSys), 2) an on-site immunoassay
DREV TNT
X
Mean of all samples in grid,
<1
less duplicates
Grid D7
<1
<1
Location of sample
Wheel for D2B
Composite = 2.9
0.6
Composite = 0.4
X = 1.8
Location of duplicate (d)
X = 1.1
4.3
0.7
A
B
2.3
D
C
Grid D4
Grid D5
Grid C4
Grid C5
Grid D1
Grid D2
A
B
A
B
A
B
A
B
A
B
A
B
D
C
D
C
D
C
D
C
D
C
D
C
Composite
Composite
Composite
Composite
Composite
Composite
TANK C
TANK D
= 23
= 3.2
= <1
= 1.2
= 3.4
= 1.7
X = 13
X = 5.8
X = <1
X = 2.0
X = 2.2
X = <1
A
B
Grid D8
Composite = 4.8
D
C
Ad
Bd
Cd
Dd
A
B
C
D
X = 6.6
13
5.7
5.6
11
2.4
23
Grid C4
A
B
19
1.4
<1
2.6
Grid C5
Grid D9
<1
<1
<1
<1
Grid D1
Composite = 1.8
D
C
3.2
3.7
1.1
3.7
<1
1.5
Grid D2
X = <1
2.1
1.6
<1
3.0
1.4
Grid D4
<1
<1
0.5
<1
Grid D5
A
B
<1
2.0
1.5
5.7
3.6
Grid D7
Grid D10
21
1.5
1.8
1.9
Grid D8
Composite = <1
1.7
<1
0.9
<1
8.5
<1
Grid D9
D
C
<1
<1
<1
<1
<1
Grid D10
X = <1
Figure 14. Sampling area at CFB-Valcartier firing range site, showing TNT concentrations from on-site colorimet-
ric analyses.
19


 Previous Page
